In our recent review of travel spending trends, we observed that the travel sector is currently navigating a complex landscape shaped by uncertain economic conditions and changes in consumer spending priorities. In this companion piece, we take a deep dive into online travel agencies (OTAs) to get more insight into that segment of the travel sector.
Utilizing Envestnet® | Yodlee®'s extensive collection of de-identified transaction data can provide greater insight as to how OTA spending patterns have evolved and trended over the past few years. Our analysis of the OTAs highlights key players such as Airbnb (ABNB), Expedia (EXPE), Booking.com (BKNG), Vrbo, Hotels.com, Priceline, Travelocity and more.
These combined views offer a look at user engagement patterns within the OTA market over the past few years, revealing interesting shifts in brand popularity over time.
OTA Spending Trends by Brand
According to Statista Market Insights, the travel and tourism industry revenue worldwide – including hotels, package holidays, vacation rentals, camping, and cruises – amounted to over $850 billion U.S. in 2023, as the industry recovered from the impact of the COVID lockdown. When looking at the market capitalization of leading online travel companies worldwide, Booking Holdings reported the highest figure in 2023, ahead of Airbnb and Trip.com Group. The firm, which owns brands like Booking.com, Kayak, and Priceline, also topped the ranking of the leading online travel agencies (OTAs) worldwide based on revenue. Expedia Group, which operates brands like Expedia, Hotels.com, and Vrbo, reported the second-highest revenue that year.
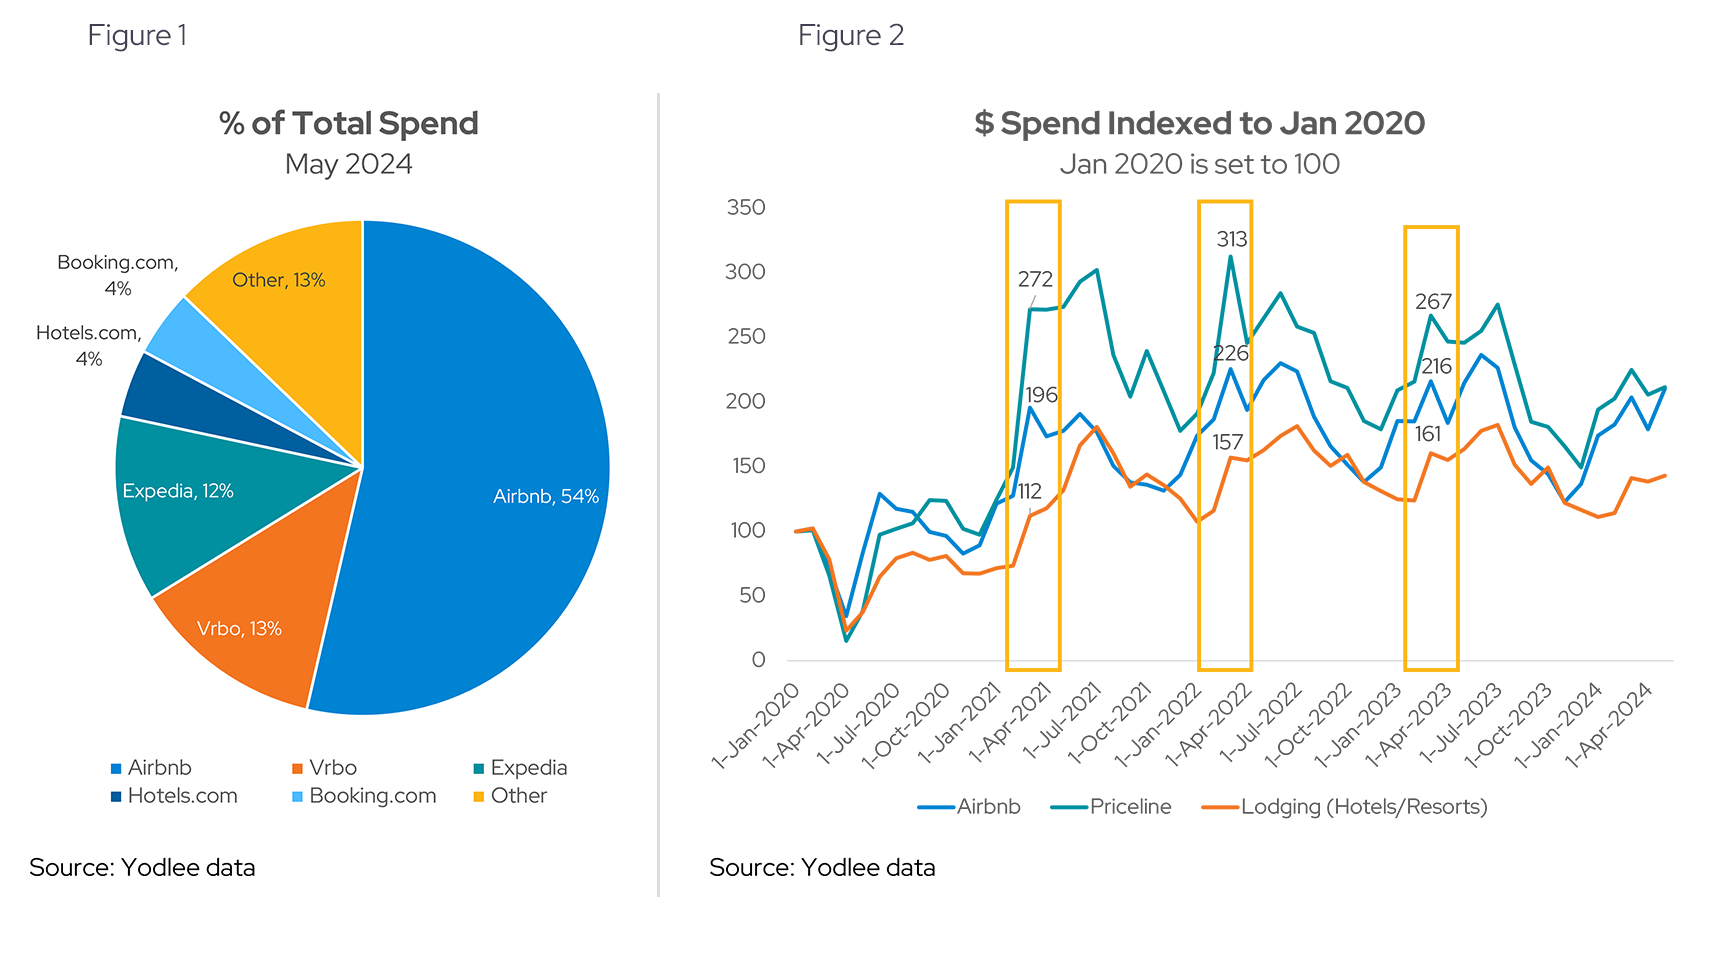
We used Yodlee data to look at spending data for 24 OTA brands (including those broken out from holding groups). In May 2024, Airbnb was the clear leader with over half of percent of total spend (54%) (see Figure 1). The rest of the market was fragmented with Vrbo having 13% followed by Expedia with 12%. Hotels.com and Bookings.com each claimed 4% share. The rest of the OTA players profiled in this analysis split the remaining 13% of the market. This analysis is not surprising in that, according to a recent article in USA Today, Airbnb and Vrbo are two of the most popular platforms for travelers looking for lodging. Phocuswright’s 2024 spring update also pointed to Airbnb as the dominant brand.
Looking at monthly spend trends between January 2020 through April 2024, Yodlee data shows that OTA platforms like Priceline and Airbnb have fared well since the start of the pandemic (see Figure 2). Spending peaks are visible in March of each year (except 2020), possibly connected to spring break travel and the lull in 2020. Pent up travel demand was evident in March 2022 as consumer spending more than tripled for Priceline and more than doubled for Airbnb.
User Engagement and Brand Popularity in the OTA Market
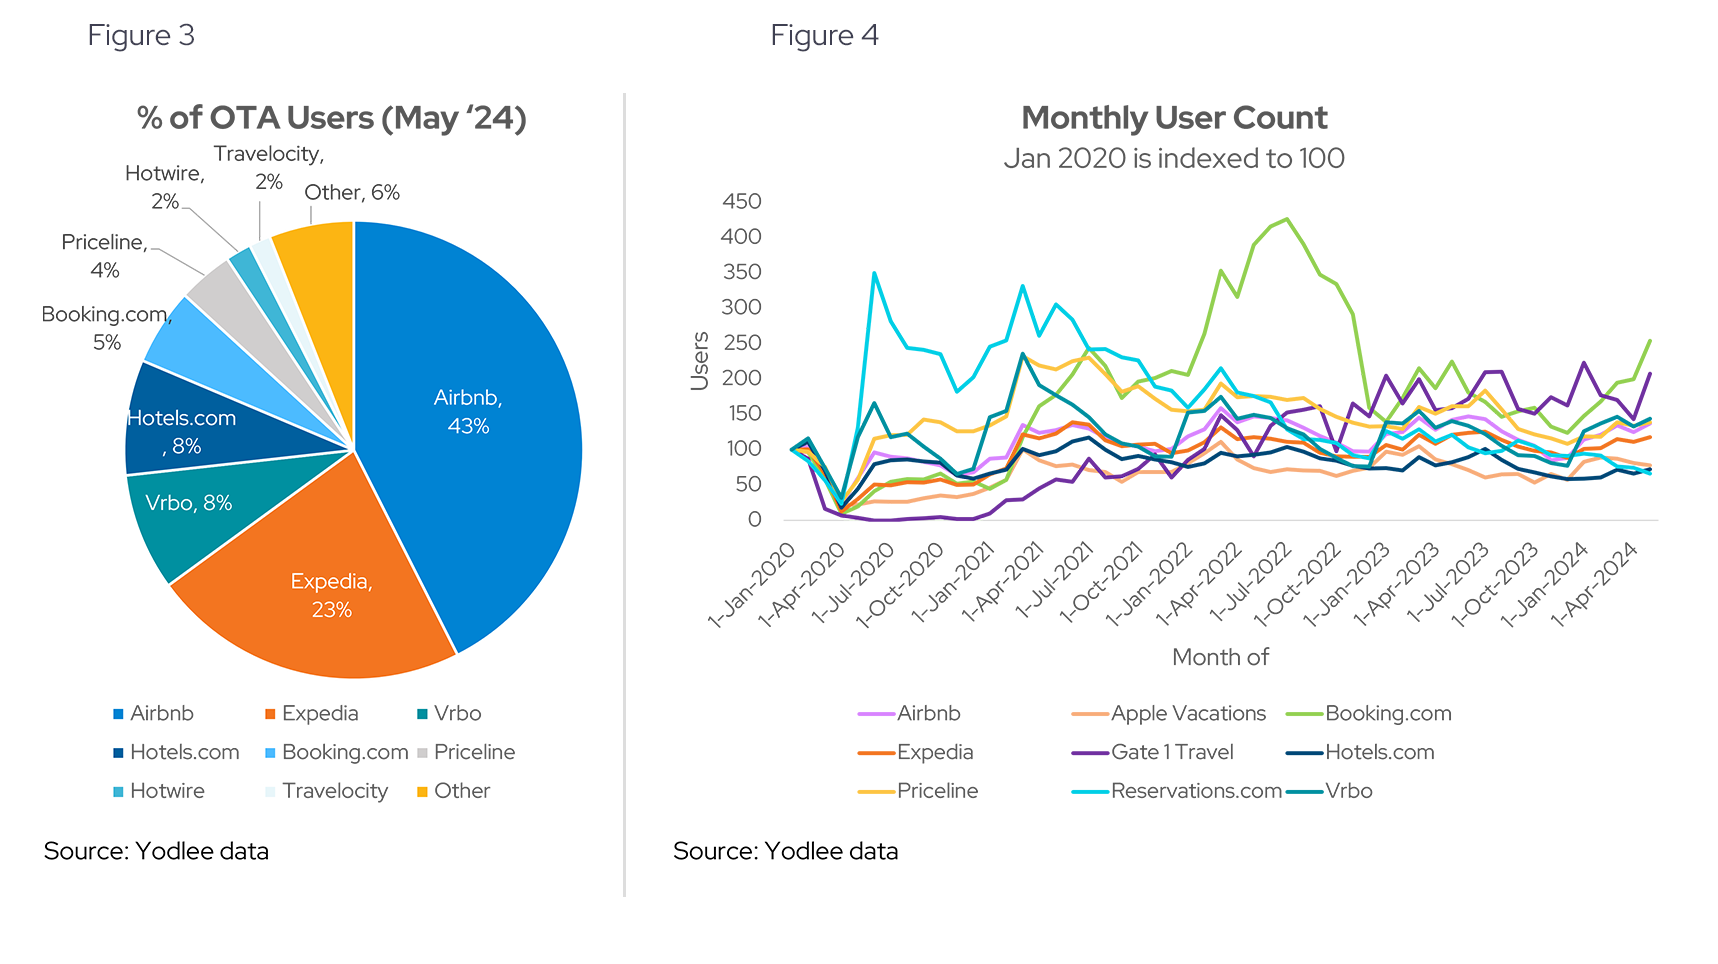
Looking at the percent of users in May 2024, unsurprisingly Airbnb led the way with 43% of users, followed by Expedia with 23% (see Figure 3). Looking at monthly user count between January 2020 through April 2024, Yodlee data suggests again that the popular OTAs saw a surge in users following COVID, which gradually stabilized by early 2022 (see Figure 4). This trend highlights the initial boost in online travel bookings as restrictions eased and travelers regained confidence, with a notable sustained activity on Booking.com well into mid-2022.
Strong Loyalty Among OTA Users vs Cross Shopping
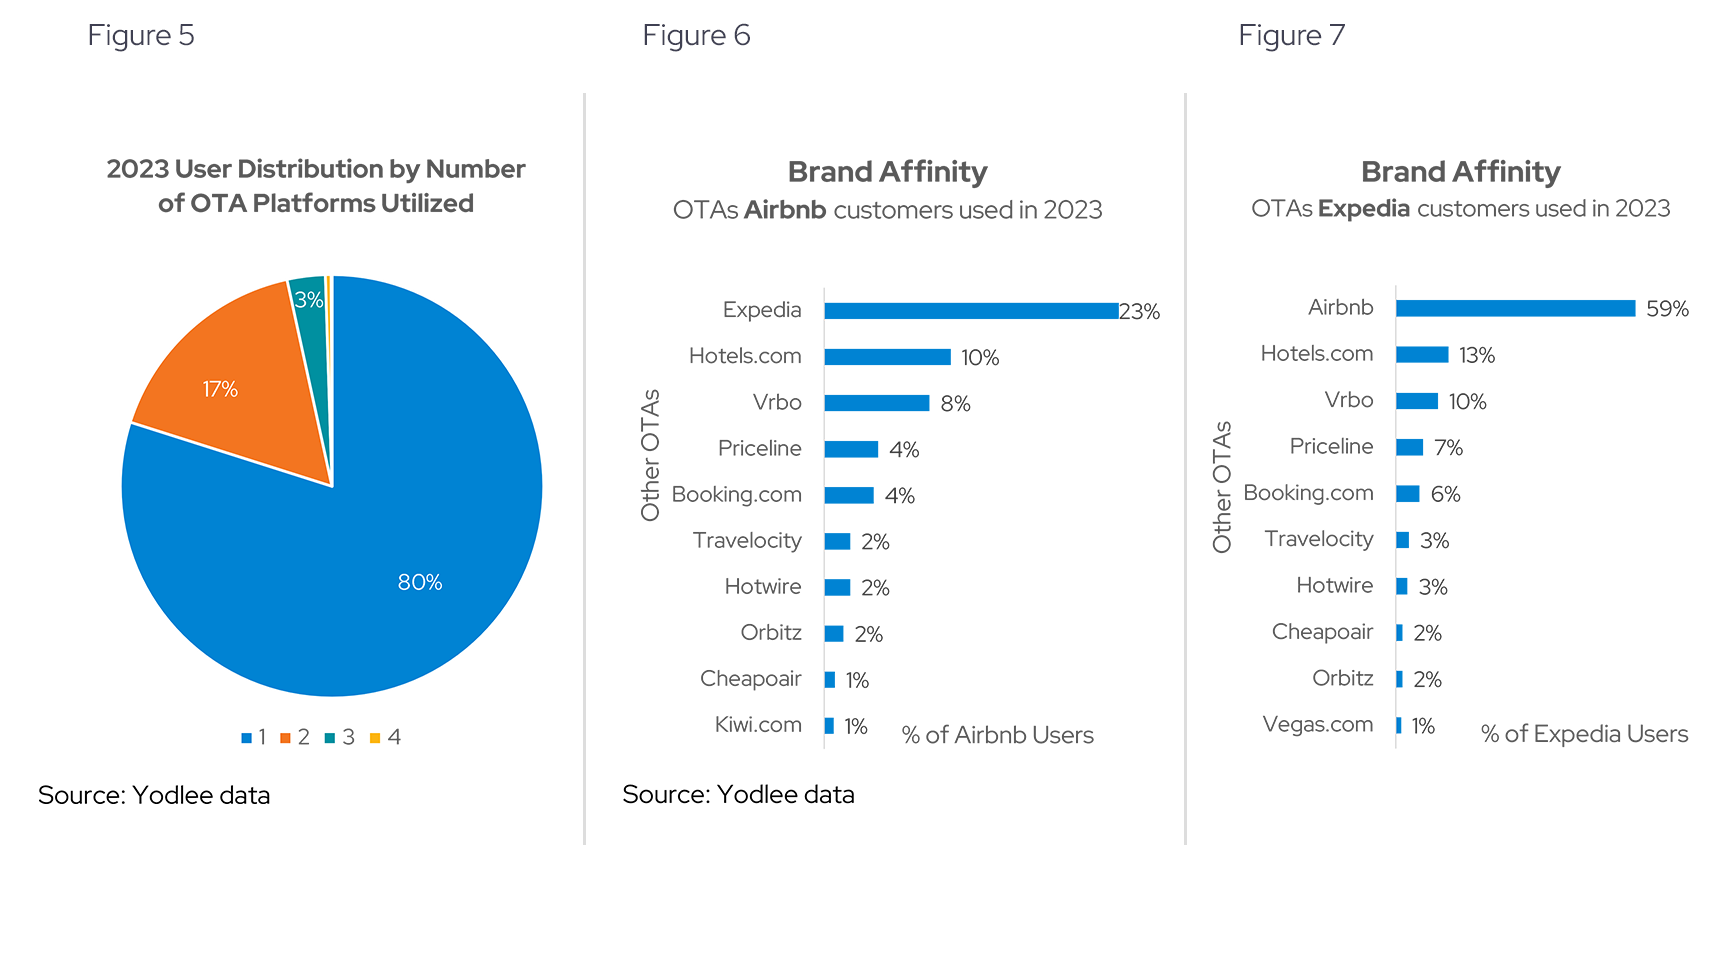
Looking at loyalty to the OTA platforms, the data indicates that 80% of users transacted via a single OTA platform in 2023 and 17% used two OTAs (see Figure 5). This high percentage of single-platform usage underscores strong brand loyalty among OTA customers, suggesting that once travelers find an OTA that meets their needs, they are likely to stick with it for their bookings.
For the 20% of users that use more than one OTA platform, the data indicates that 23% of Airbnb users also spent via Expedia and 59% of Expedia users also spent via Airbnb (see Figure 6). This overlap suggest that segment of travelers compare options and prices across different OTAs to find the best deals and services and tend to use Airbnb and Expedia most often.
Tracking Market Evolution with Transaction Data Insights
Airbnb has emerged as a dominant force in the online travel agency market. The data reveals trends in user engagement, spending patterns, and brand loyalty, illustrating how travelers are adapting their preferences in a post-pandemic world. As OTAs like Airbnb and Expedia continue to innovate and expand their offerings, understanding these dynamics will be crucial for staying ahead in the competitive travel industry. By keeping a pulse on these trends, stakeholders can better anticipate changes and cater to the diverse needs of modern travelers, ensuring sustained growth and customer satisfaction in the years to come.
Want to get ahead of consumer spending trends?
Subscribe to our research data blog for ongoing updates or reach out for a personalized, up-to-date view of Yodlee consumer spending data.
About Envestnet | Yodlee Merchant, Retail, Shopper, and Spend Insights
Envestnet | Yodlee Merchant, Retail, Shopper, and Spend Insights utilize de-identified transaction data from a diverse and dynamic set of data from millions of accounts to identify patterns and context to inform spending and income trends. The trends reflect analysis and insights from the Envestnet | Yodlee data analysis team. By combining data with intelligence – connecting vast amounts of actual de-identified shopping data with state-of-the-art analytics and machine learning – Envestnet | Yodlee provides visibility into a large set of shopping daily purchase behavior including, but not limited to, transactions, customer lifetime values, and merchant/retailer shares.
To learn more about Envestnet | Yodlee Merchant and Retail Insights and get a free demo, please contact an Envestnet | Yodlee sales representative.