Grocery prices remain a major concern for consumers, with inflation continuing to push food costs higher in 2024. Two-thirds of U.S. adults say inflation is their biggest financial concern, according to a recent survey by Northwestern Mutual. More than half of respondents to the survey said inflation is rising faster than their household income and over 80% said they have experienced higher grocery bills in the last three months.
But today’s prices don’t exist in a vacuum—understanding how grocery spending has evolved over the past five years provides critical context for what’s happening now.
Yodlee®’s de-identified transaction data highlights key trends in grocery spending, from shifting online and in-store behaviors to the widening income-based disparities that shape how different households are managing rising costs, as well as those chains which have fared better than average of late. Our analysis covers year-over-year sales, average transaction size, and spend per shopper across leading grocery retailers, including Aldi, Kroger (KR), Grocery Outlet (GO), Market Basket, Safeway, Sprouts Farmers Market (SFM), and Whole Foods Market (AMZN). These insights provide a data-driven look at how grocery spending evolved in 2024.
Rising Grocery Spend
Note: Aggregated Grocery Sales include transactions with Yodlee transaction_category_name = ‘Groceries, including chains such as Kroger, Aldi,’ Sprouts Farmers Market, Market Basket, Safeway, Whole Foods Market, 'H-E-B','Giant Eagle’, Grocery Outlet, and others.
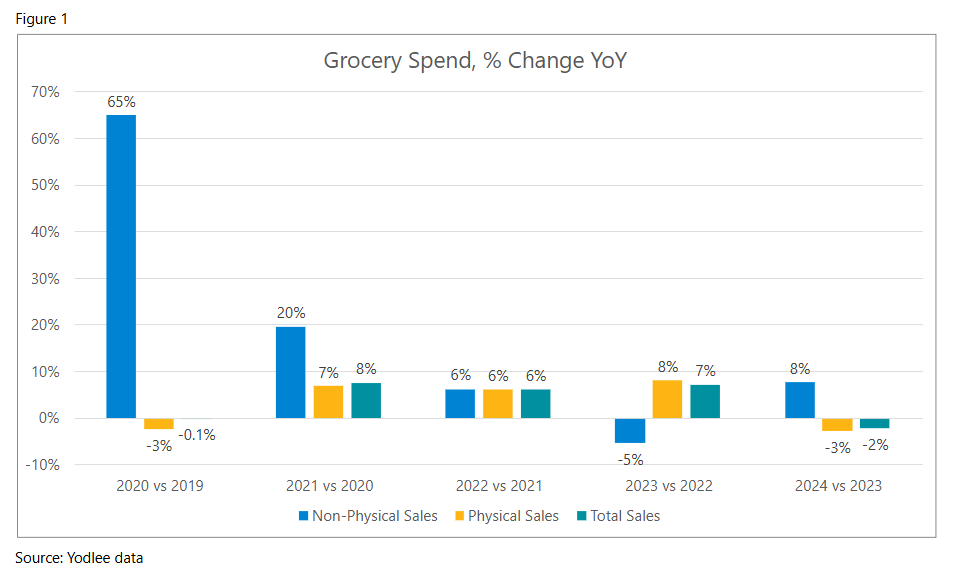
Looking at year-over-year (YoY) spend on groceries from 2019 to 2024, Yodlee data shows that total grocery sales increased in 2021, 2022 and 2023 and decreased slightly (-2%) in 2024 (see Figure 1). There were distinct shifts between online and physical sales from 2020 to 2024. There was an expected spike in online sales in 2020 and 2021 during the pandemic. After a moderation in 2023, online sales picked up in 2024.
But this growth in online sales didn’t turnaround overall sales, which resulted in lackluster growth in 2024. According to Supermarket News, the U.S. grocery retail market grew by only 1.1% in 2024, down from 3.9% in 2023, reflecting a broader slowdown in overall growth. These trends coincided with inflation in grocery prices. The Consumer Price Index for food at home (this includes grocery store or supermarket purchases) increased by 1.8% from December 2023 to December 2024, signaling rising food prices over the year.
Aldi and Kroger Closed Out 2024 on Top
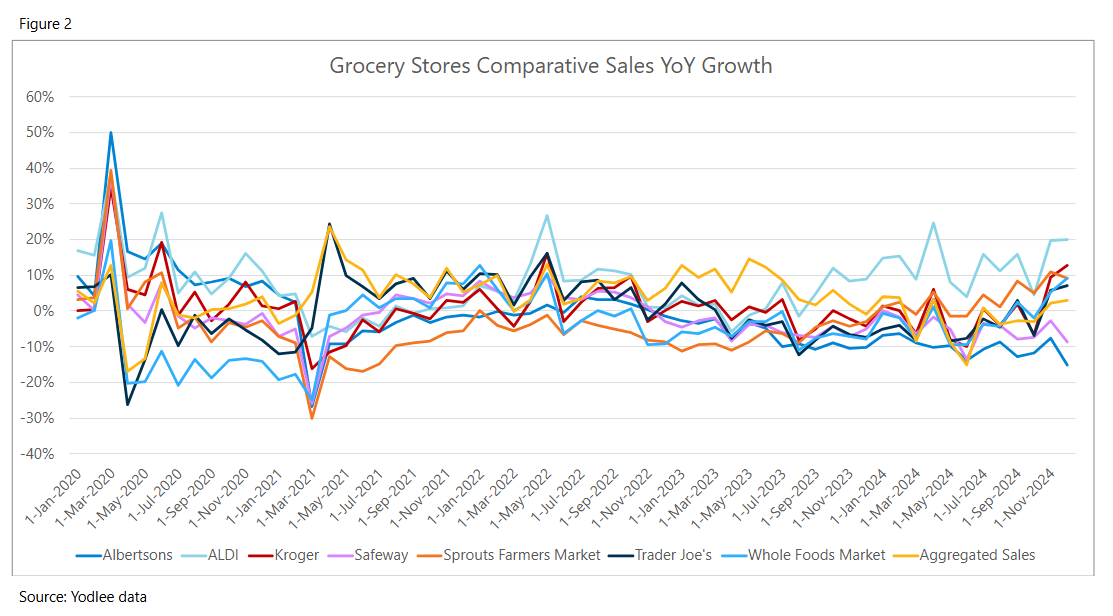
Despite the softness in total grocery sales in 2024, several chains significantly outperformed aggregate sales (see Figure 2). Of the cohort of stores analyzed, Yodlee data shows that Aldi and Kroger were among the top performers.
Produce Blue Book reports that Aldi plans to expand by adding 800 new stores. Similarly, Kroger reported a 2.3% increase in sales and 11% growth in digital sales in the third quarter of 2024, with its private label brands growing faster than overall grocery sales.
Stable Transaction Sizes Across Grocery Chains
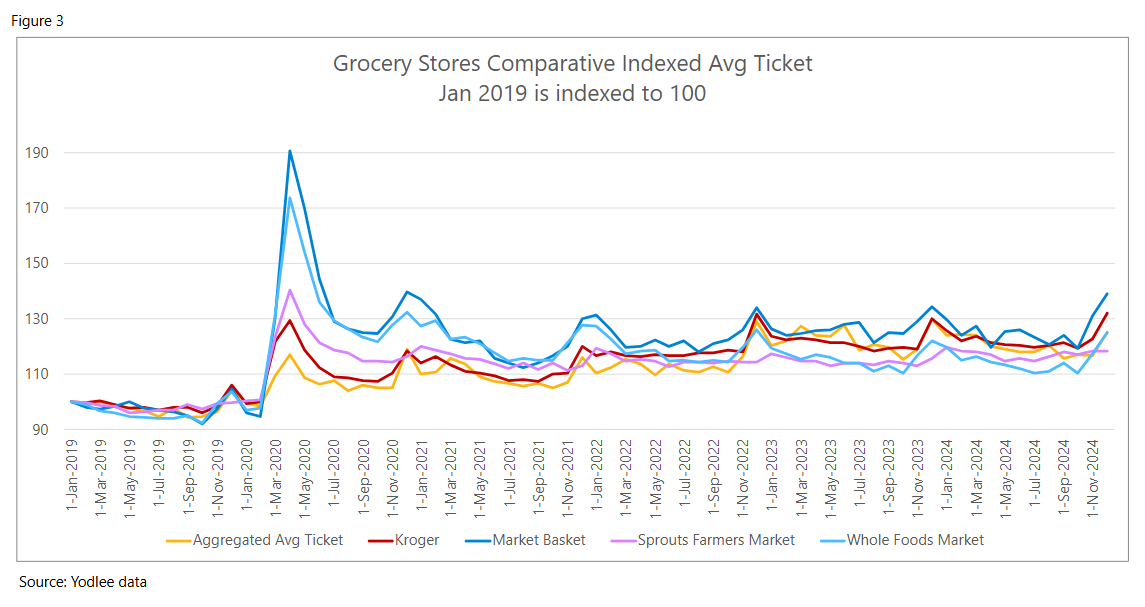
With January 2019 indexed to 100, we can see five years of Yodlee data demonstrating how the average ticket size has shifted between 2019-2024 (see the yellow line in Figure 3). There was a large increase in average ticket increasing sharply starting in March 2020, due to the pandemic. After that, there was variability through 2024 with the high point coming in December 2022. The average ticket has not been below the index point since February 2020.
Figure 3 shows four grocery chains (Kroger, Market Basket, Sprouts Farmers Market and Whole Foods) to demonstrate how they performed in relation to the aggregated average ticket price. While some of those stores had an average ticket below the aggregated average, they all ended 2024 above the average.
Variation in Spend per Shopper
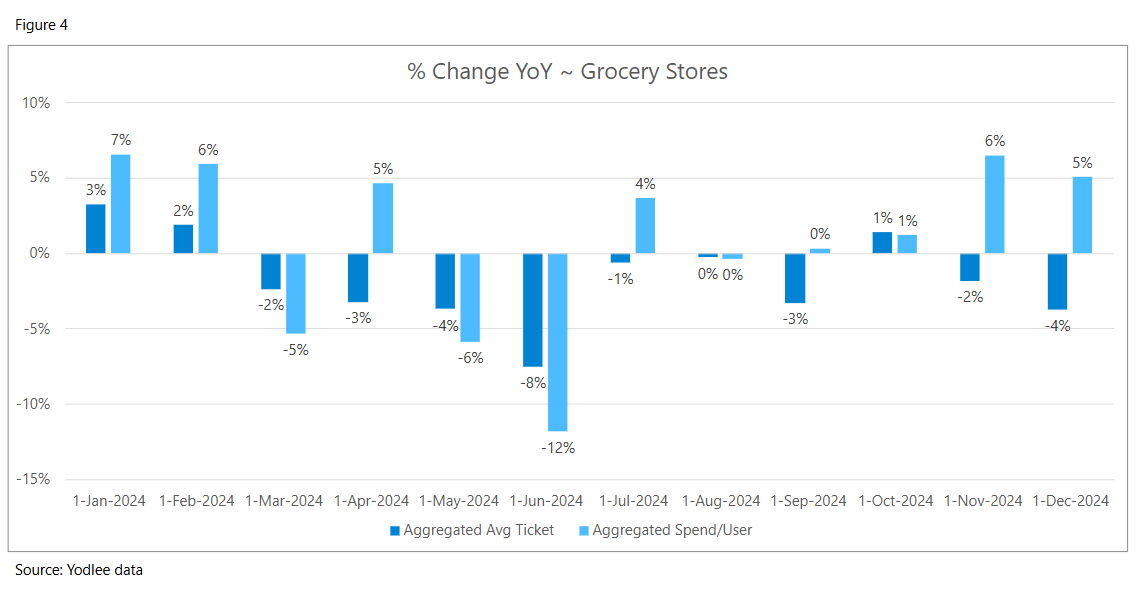
Focusing in on 2024, Yodlee data indicates that individual shopper spending varied throughout the year (see Figure 4). Spend per shopper grew strongly early in the year, saw setbacks in the spring, and then rebounded in the latter half, particularly in November and December when seasonal spend reflected an uptick.
This increase in spend aligns with the U.S. Census Bureau's Monthly Retail Trade Report, which shows that retail trade sales, including grocery store sales, increased 0.6% in December 2024 compared to November and were up 4.2% from December 2023.
Income-Based Spending Disparities
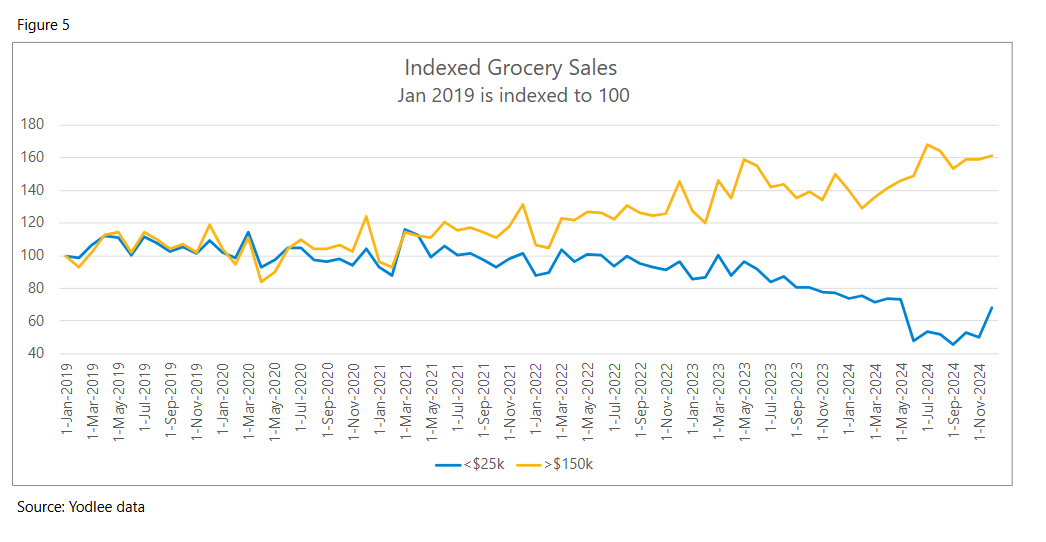
According to Yodlee data, there has been a widening spend gap between the highest and lowest income groups, highlighting the growing disparity in grocery purchasing between 2019-2024 (see Figure 5). The spend for the two groups was similar from January 2019 through April 2021. After that, Figure 5 shows a widening gap between the groups. By December 2024, the spend of the highest income group (>$150k) was at 160 and the lowest income group (<$25k) was at 68 (with January 2019 indexed to 100).
According to USDA data, the lowest-income households spent 32.6% of their after-tax income on food, compared to just 8.1% for higher earners. This highlights that while per-transaction spending is comparable, food expenses account for a significantly larger share of income for lower-income households.
Five Years of Grocery Spending: Rising Costs and Widening Gaps
Over the past five years, grocery spending has undergone significant shifts, shaped by inflation, evolving shopping habits, and widening income disparities.
The gap between high- and low-income households has grown and several major retailers like Aldi and Kroger have adapted to shifting market conditions and have outperformed peers, leveraging affordability to maintain momentum.
Yodlee data provides a comprehensive view of how these trends have evolved, offering valuable insights into the dynamics shaping grocery spending today. By understanding how spending patterns have changed since 2019, businesses, investors, and policymakers can better anticipate future shifts in consumer behavior.
Want to see how transaction data can inform your investment process?
Learn more about Yodlee Merchant and Retail Insights and get a free demo from a sales representative.
About Yodlee Merchant, Retail, Shopper, and Spend Insights
Yodlee Merchant, Retail, Shopper, and Spend Insights utilize de-identified transaction data from a diverse and dynamic set of data from millions of accounts to identify patterns and context to inform spending and income trends. The trends reflect analysis and insights from the Yodlee data analysis team. By combining data with intelligence – connecting vast amounts of actual de-identified shopping data with state-of-the-art analytics and machine learning – Yodlee provides visibility into a large set of shopping daily purchase behavior including, but not limited to, transactions, customer lifetime values, and merchant/retailer shares.