We have done a review of 2024 U.S. restaurant industry trends across both full-service chains (which includes fine dining and casual dining) and limited-service brands (which includes both quick service restaurants (QSRs) and casual dining. The data revealed spending fluctuations throughout 2024 but a strong finish to the year. The data shows some notable shifts in consumer spending habits over the period, with a wider disparity in average spend among limited-service restaurants. Full-service dining, although hit by overall larger declines, experienced a narrower range of average spend declines.
Drawing from Yodlee's de-identified transaction data, we examined year-over-year restaurant sales, average spend per user, and average ticket size across well-known brands. Our analysis includes full-service chains like Maggiano’s Little Italy, Red Robin (RRGB), Chili’s (EAT), and P.F. Chang’s, as well as limited-service brands such as Taco Bell (YUM), Dunkin' (DNKN), McDonald’s (MCD), and Jack in the Box (JACK). Our analysis below highlights where consumers spent the most in 2024, which segments struggled, and how consumer restaurant spending trends evolved.
2024 Was a Year of Fluctuations in Restaurant Sales
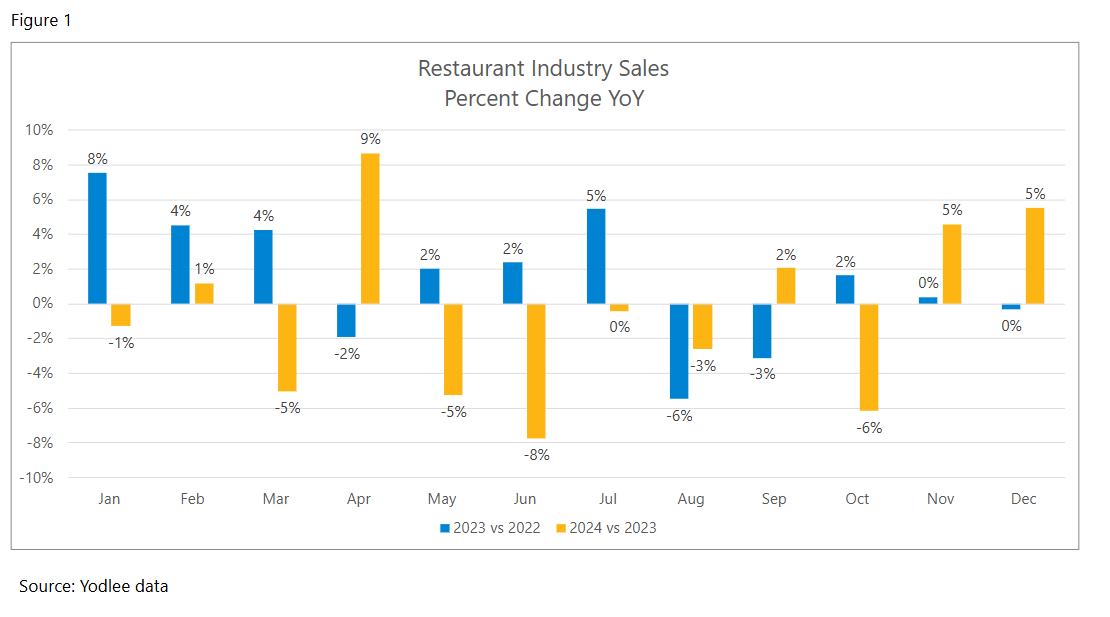
Yodlee data shows that restaurant spending in 2024 was marked by sharp fluctuations. The one bright spot in the first half of the year was a strong April, which was then followed by notably weaker trends in May and June (see Figure 1). The industry regained momentum towards the end of the year and restaurant sales ended on a high note.
A report from Black Box Intelligence confirmed this end of year uptick, highlighting that a combined view of November and December showed a strong 1.1% same-store sales growth, marking the strongest combined average growth rate for restaurant sales of any month in 2024.
Average Spend Increased Until a Holiday Surge
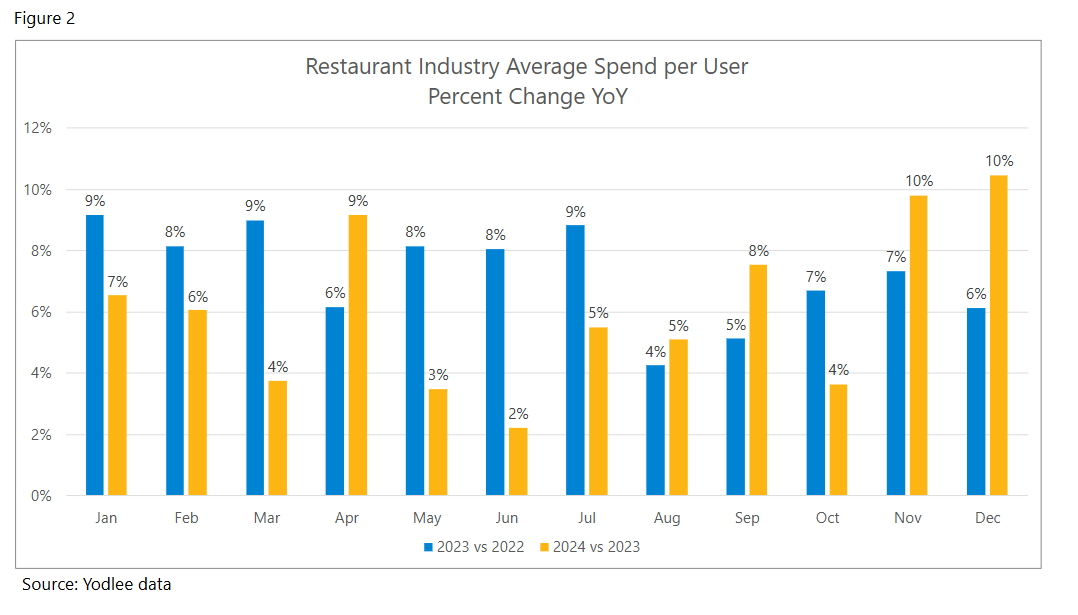
Looking at the average spend per user tells a similar story regarding how diners spent at restaurants throughout the year. In 2024, average user spend went up mid-single digits throughout the year (see Figure 2). The strong year-end growth suggests that consumers were spending more per visit during the holiday season, helping to drive the restaurant industry’s late year rebound.
Fast and Convenient Dining Led Restaurant Sales in 2024
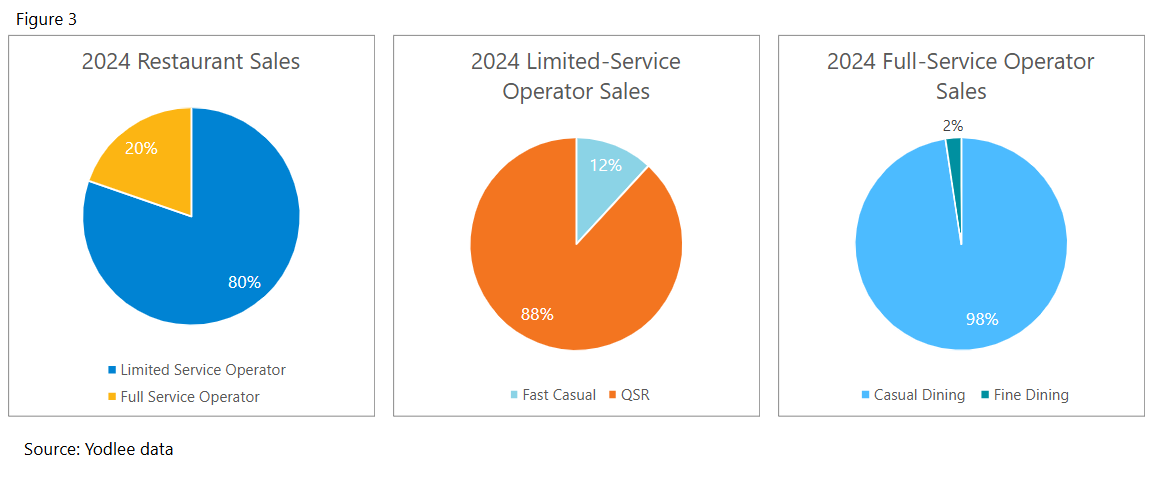
Note: These charts constitute a major subset of the restaurant industry. More information can be provided upon request.
Yodlee data for the companies mentioned above indicates that most of 2024’s restaurant spending was concentrated in limited-service restaurants, which accounted for over 80% of the restaurants analyzed (see Figure 3). Quick-service restaurants (QSRs) spend represented most of this category, reinforcing the dominance of fast, convenient dining. Meanwhile, fast-casual restaurants held a smaller but notable share within limited service. Full-service restaurants, which include traditional sit-down dining, contributed just under 20% of total revenue—highlighting the ongoing consumer preference for faster, more accessible dining options.
Full-Service Restaurants Faced Heavier Declines Than Limited-Service in 2024
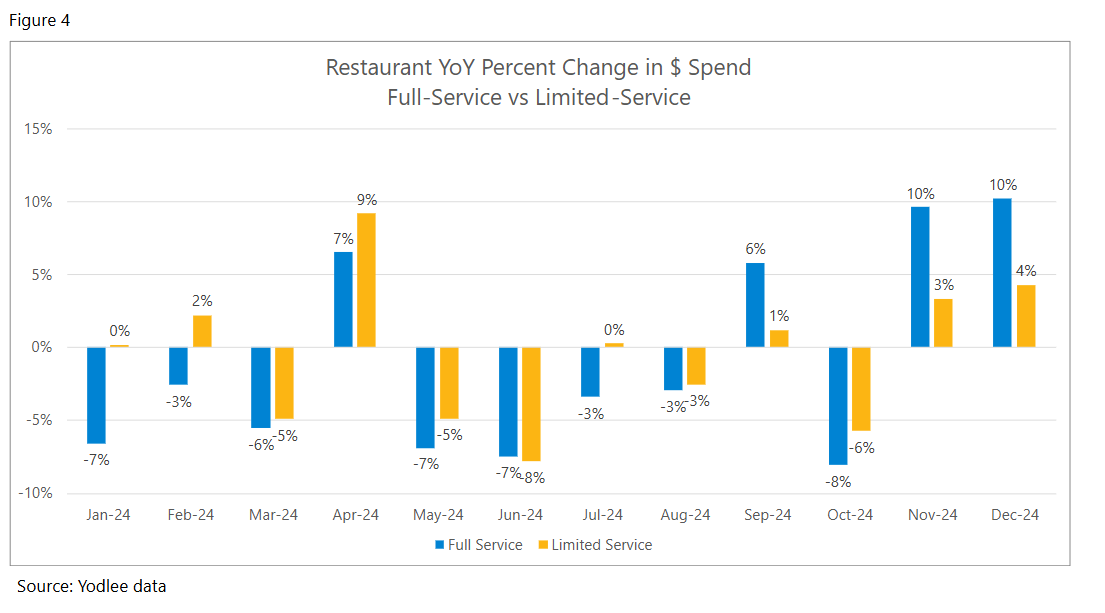
Yodlee data for the restaurants we reviewed suggest that consumer spending faced steeper declines most of the year than at limited-service restaurants in 2024 (see Figure 4). Full-service dining saw multiple months of year-over-year declines, particularly in January, March, and May. In contrast, limited-service restaurants sustained smaller fluctuations. This pattern underscores the resilience of quick-service and fast-casual dining, which proved to be the more stable choice throughout the year, even as full-service restaurants faced larger swings in consumer demand.
The full-service segment continues to reel from pandemic-related challenges as well as consumers who are more convenience and speed minded. According to Technomic data, the full-service segment has lost three full percentage points of industry share in the past four years – 21% at the end of 2023 from 24% in 2019.
Morningstar reported that the full-service restaurant industry posted anemic average annual sales growth of just 1%-2% over the past decade, well behind limited-service peers' 3%-4% clip. And Time Magazine highlighted that sit-down chain restaurants faced significant financial challenges, with several major chains filing for bankruptcy or closing numerous locations. Economic conditions, high inflation, and increasing labor costs heavily impacted these businesses, leading many customers to opt for lower-cost fast-food options instead of dining at more expensive sit-down restaurants.
Fine Dining Struggled in 2024 but Rebounded by Year-End
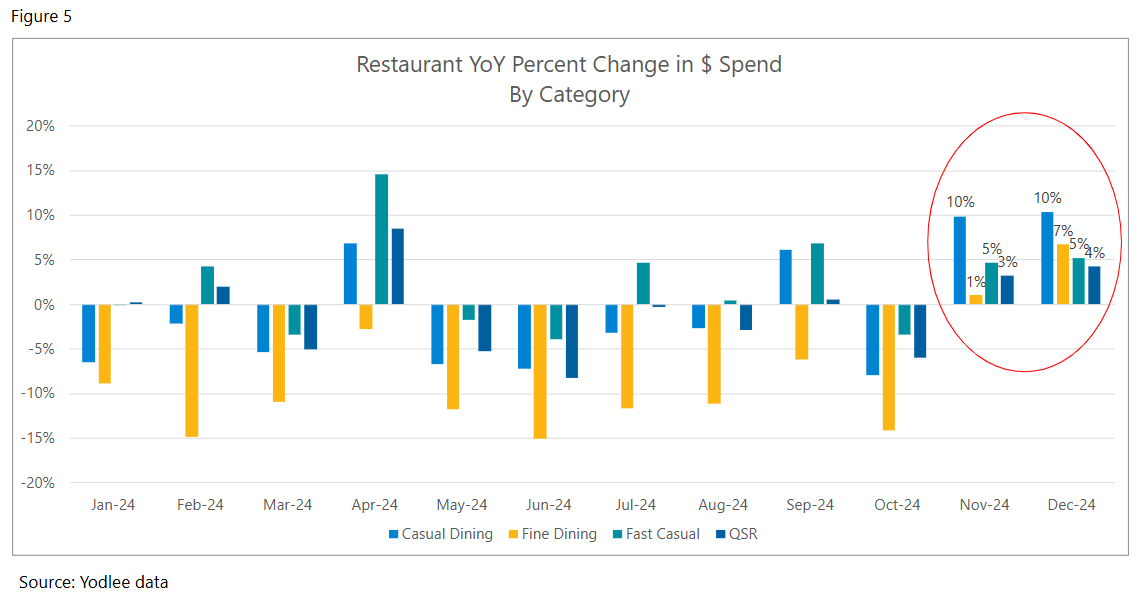
Restaurant spending across all segments showed strong momentum at year end, with notable gains in November and December, according to Yodlee data (see Figure 5). Casual dining, fast casual, and QSRs all experienced fluctuations throughout the year but finished with solid year-over-year growth in the final months.
Restaurant Business Online noted that full-service restaurants, including fine dining, bore the brunt of the downturn, with sales growth projections lagging behind limited-service counterparts.
Higher-End Casual Dining Thrived, but Some Chains Struggled in 2024
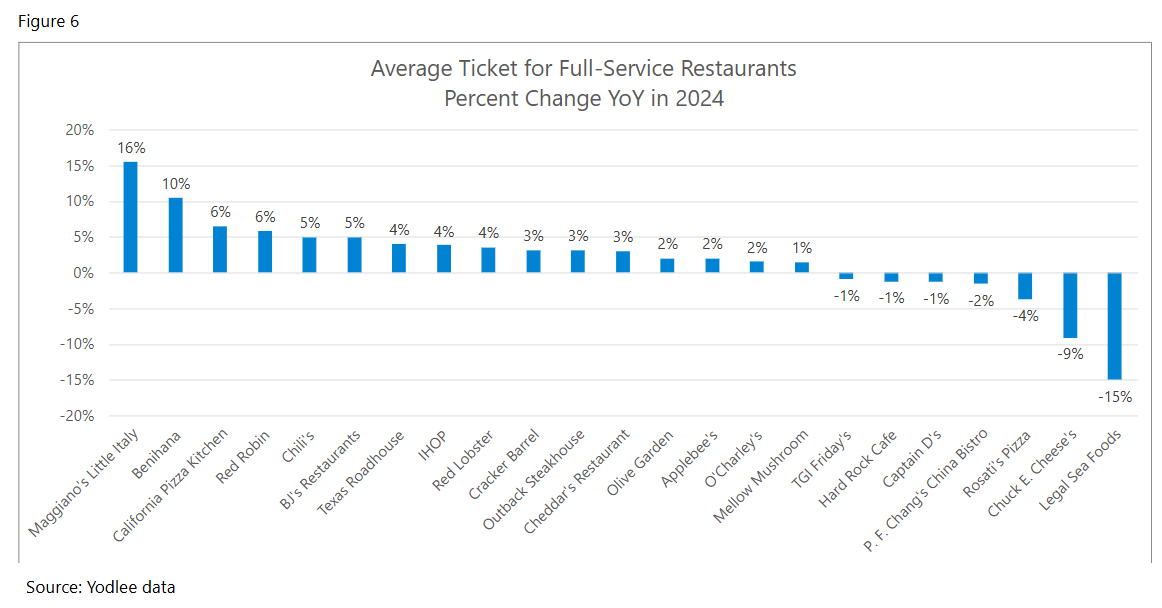
Yodlee data suggests that full-service restaurants saw mixed results in average ticket growth in 2024, with higher-end casual dining chains leading the gains (see Figure 6). Maggiano’s Little Italy and Benihana posted the strongest increases, suggesting that consumers were willing to spend more at select premium casual dining spots. California Pizza Kitchen, Red Robin (RRGB), and Chili’s (EAT) also saw steady increases, though at a more moderate pace.
However, not all full-service restaurants benefited—TGI Friday’s, P.F. Chang’s, and Legal Sea Foods ended the year in negative territory, indicating that some brands struggled to drive higher spending per visit. This uneven performance suggests that while consumers remained willing to spend more at full-service restaurants, they were selective in where they dined.
Fast Food and Fast Casual Saw Bigger Highs—and Lows—in 2024
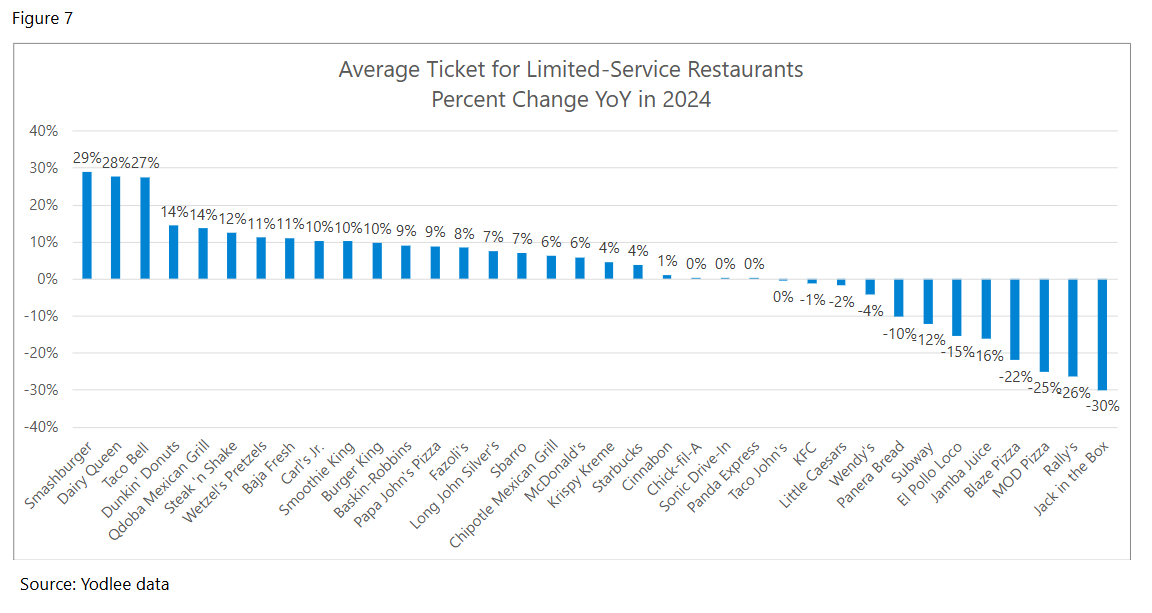
Limited-service restaurants saw much higher growth—and sharper declines—than full-service restaurants in 2024. Chains like Smashburger, Dairy Queen, and Taco Bell (YUM) led the way, posting significant increases in average ticket size, suggesting strong pricing power or larger order sizes. Dunkin' (DNKN) and Qdoba also experienced solid growth, reinforcing the strength of the quick-service segment.
However, not all brands saw gains. Jack in the Box (JACK), Rally’s, and MOD Pizza posted double digit declines, while Subway and Panera Bread also struggled, pointing to weaker consumer spending at these chains. Compared to full-service restaurants, limited-service brands saw much more extreme swings in ticket growth, highlighting a diverging landscape where some brands thrived while others saw significant declines in spending per order.
2024 Restaurant Spending: A Year of Fluctuations, Shifting Preferences, and a Strong Finish
Restaurant spending in 2024 was uneven but ended on a high note. Limited-service restaurants saw the biggest swings, with strong gains at some brands while others struggled. Full-service dining faced more stability but also selective growth, with higher-end casual chains seeing the biggest ticket increases. Fine dining lagged for most of the year but rebounded late.
The biggest takeaway? Consumers continued dining out but were more selective, favoring affordability, convenience, and perceived value. The industry’s late year rebound signals resilience, but success in 2025 will depend on brands adapting to evolving spending habits.
Want to see how transaction data can inform your investment process?
Learn more about Yodlee Merchant and Retail Insights and get a free demo from a sales representative.
About Yodlee Merchant, Retail, Shopper, and Spend Insights
Yodlee Merchant, Retail, Shopper, and Spend Insights utilize de-identified transaction data from a diverse and dynamic set of data from millions of accounts to identify patterns and context to inform spending and income trends. The trends reflect analysis and insights from the Yodlee data analysis team. By combining data with intelligence – connecting vast amounts of actual de-identified shopping data with state-of-the-art analytics and machine learning – Yodlee provides visibility into a large set of shopping daily purchase behavior including, but not limited to, transactions, customer lifetime values, and merchant/retailer shares.