
Home furnishing spending has experienced notable changes since 2020, reflecting evolving consumer preferences and economic dynamics. As people continue to prioritize the comfort and aesthetics of their living spaces, there has been a consistent investment in home furnishings, driving growth and innovation in the sector.
This blog post dives into the latest trends and patterns in home furnishing spending, spotlighting shifts in consumer behavior and their implications for retailers. By analyzing Envestnet® | Yodlee®'s deidentified transaction data and spending behaviors, we aim to provide a deep dive into the current state of the home furnishing market by looking at data from key players in the market including Bed Bath & Beyond (BBBY), HomeGoods (TJX), Wayfair (W), Restoration Hardware (RH), Sleep Number (SNBR), Williams-Sonoma (WSM), Ethan Allen (ETH), Bassett Furniture (BSET), The Tile Shop (TTS), Havertys (HVT), and Arhaus Furniture (ARHS).
Home furnishing chain spend has receded and stabilized
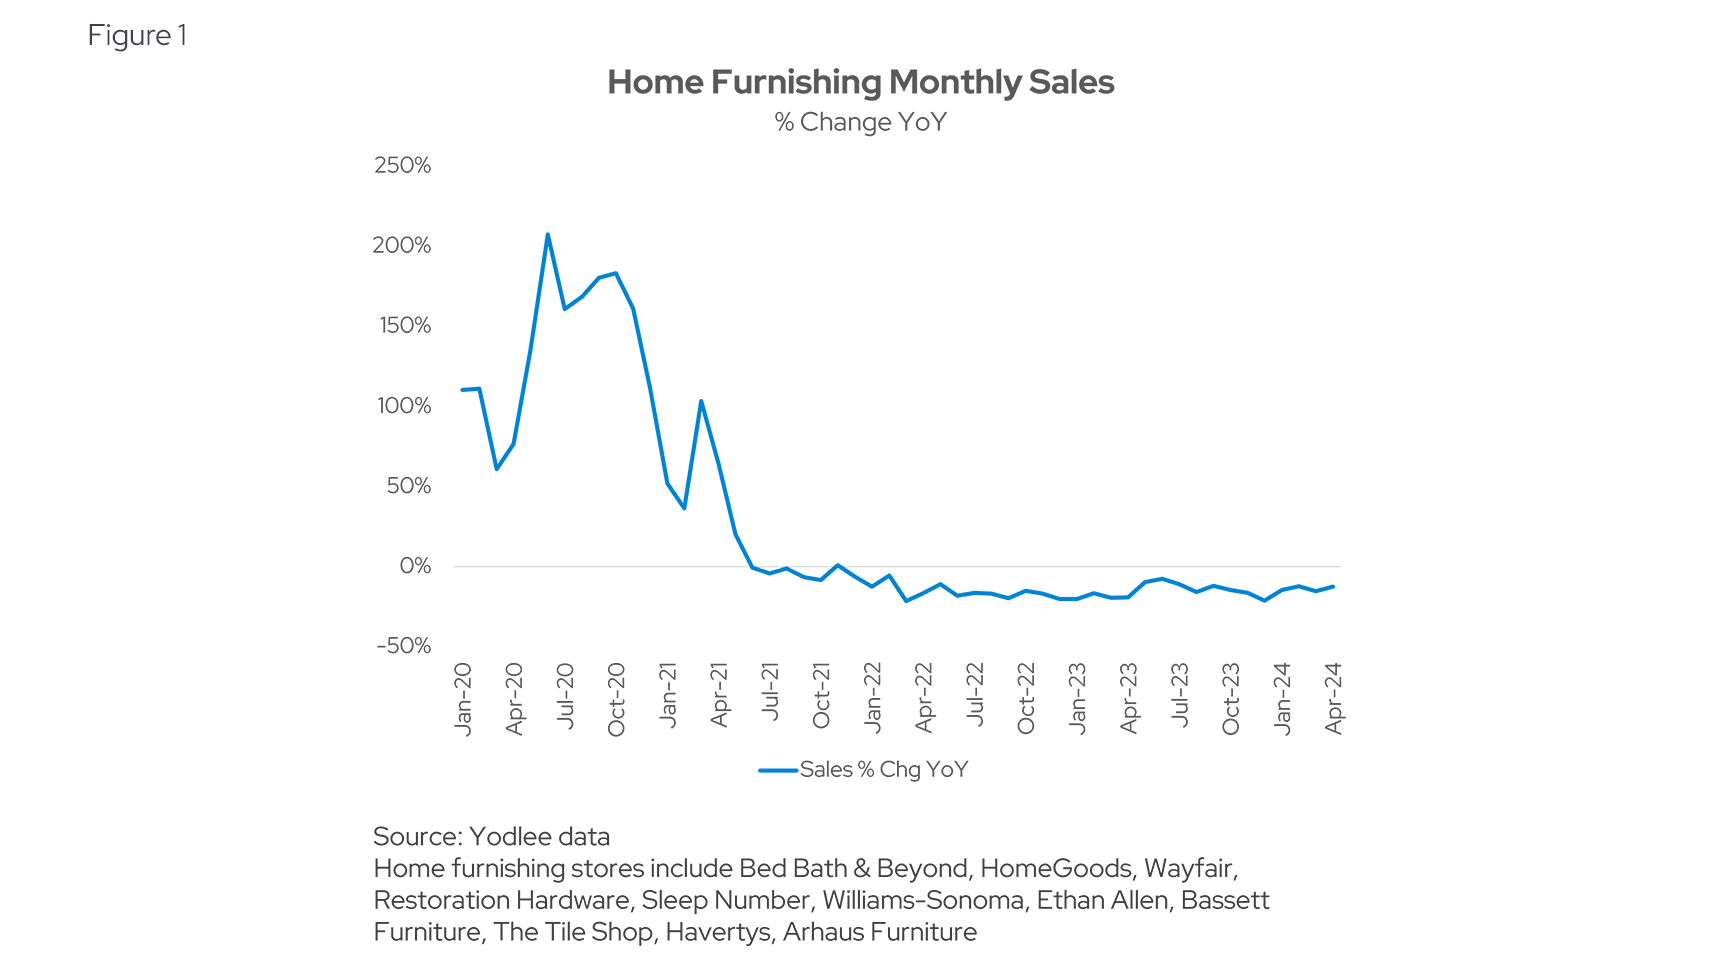
Following a pattern similar to the home improvement market (see our recent review of retail spending trends), the home furnishing sector experienced significant growth as people invested more in their living spaces. However, beginning in early 2022, year-over-year spending in this category shifted into negative territory and has remained rangebound for over two years (see Figure 1). This stabilization indicates a return to more typical spending patterns as the surge in home furnishing investments levels off.
Wayfair is the dominant market leader
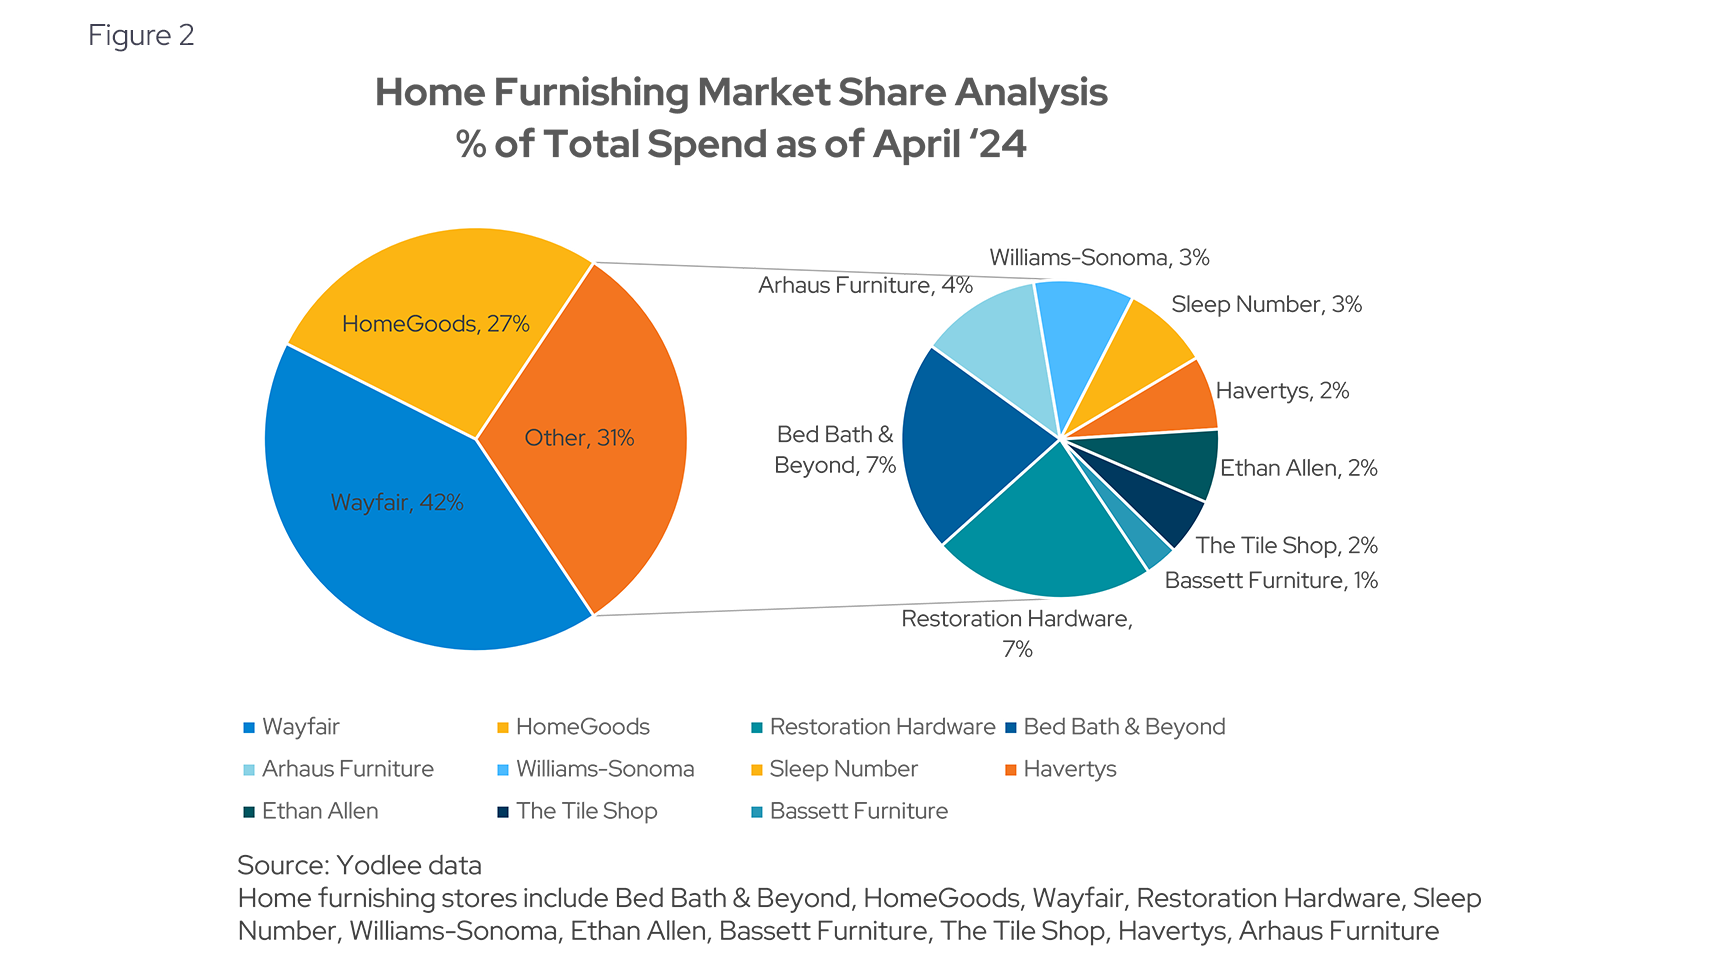
Figure 2 illustrates Wayfair's dominant position in the home furnishing market, commanding a substantial 42% market share versus peers. Along with HomeGoods, which holds 27%, these two retailers account for more than half of the market. The remaining third is divided among nine other brands, with Bed Bath & Beyond and Restoration Hardware each capturing 7% of the market share as of April 2024. This distribution underscores Wayfair's strong market presence and the competitive landscape within the industry.
Bed Bath & Beyond loses share as it closes physical stores
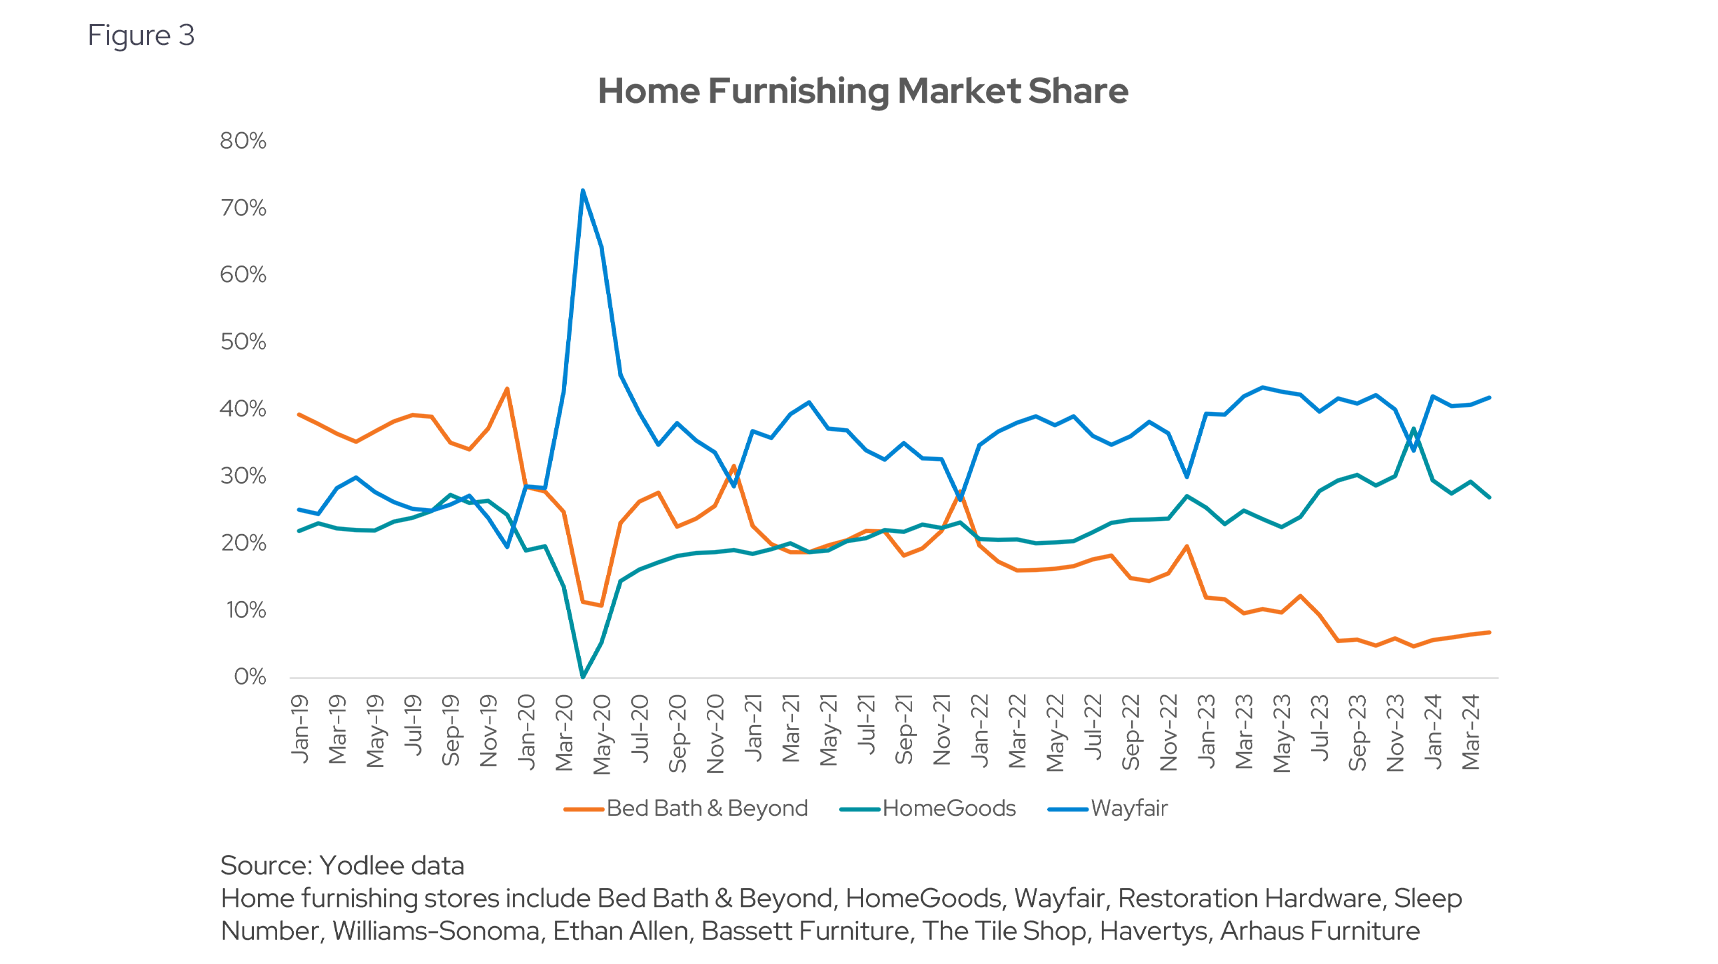
In April 2023, Bed Bath & Beyond announced its decision to close all physical locations by June 30, 2023 transitioning to an online-only model after filing for Chapter 11 bankruptcy. This strategic shift allowed competitors like Wayfair and HomeGoods to capture more than half of Bed Bath & Beyond's market share, as depicted in Figure 3. This significant market redistribution highlights the impact of retail strategy changes on competitive dynamics within the home furnishing sector.
Users and spend per user is stable
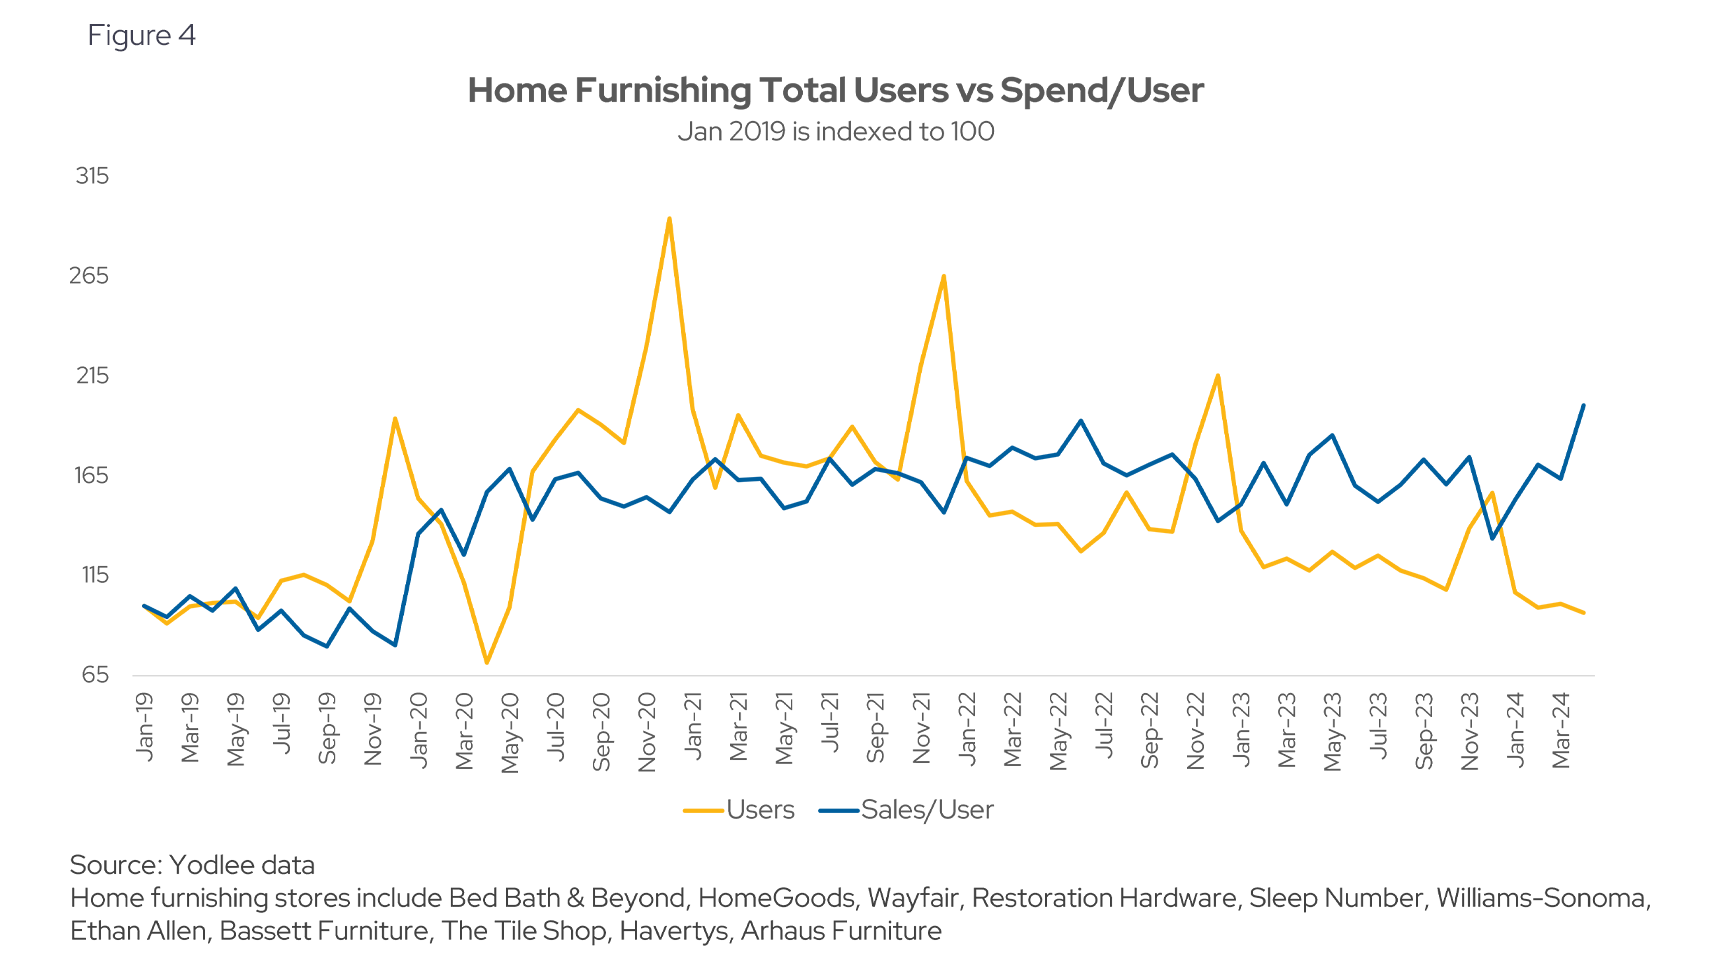
Despite a reduction in the overall number of home furnishing users post-COVID, the spending habits of active purchasers have remained consistent. Figure 4 indicates that the number of users has stabilized over the past few years, with predictable spikes during the holiday season. Additionally, the average order value, or spend per user, has shown remarkable stability, underscoring the enduring demand for home furnishing products among engaged consumers.
High income earners drive the home furnishing market
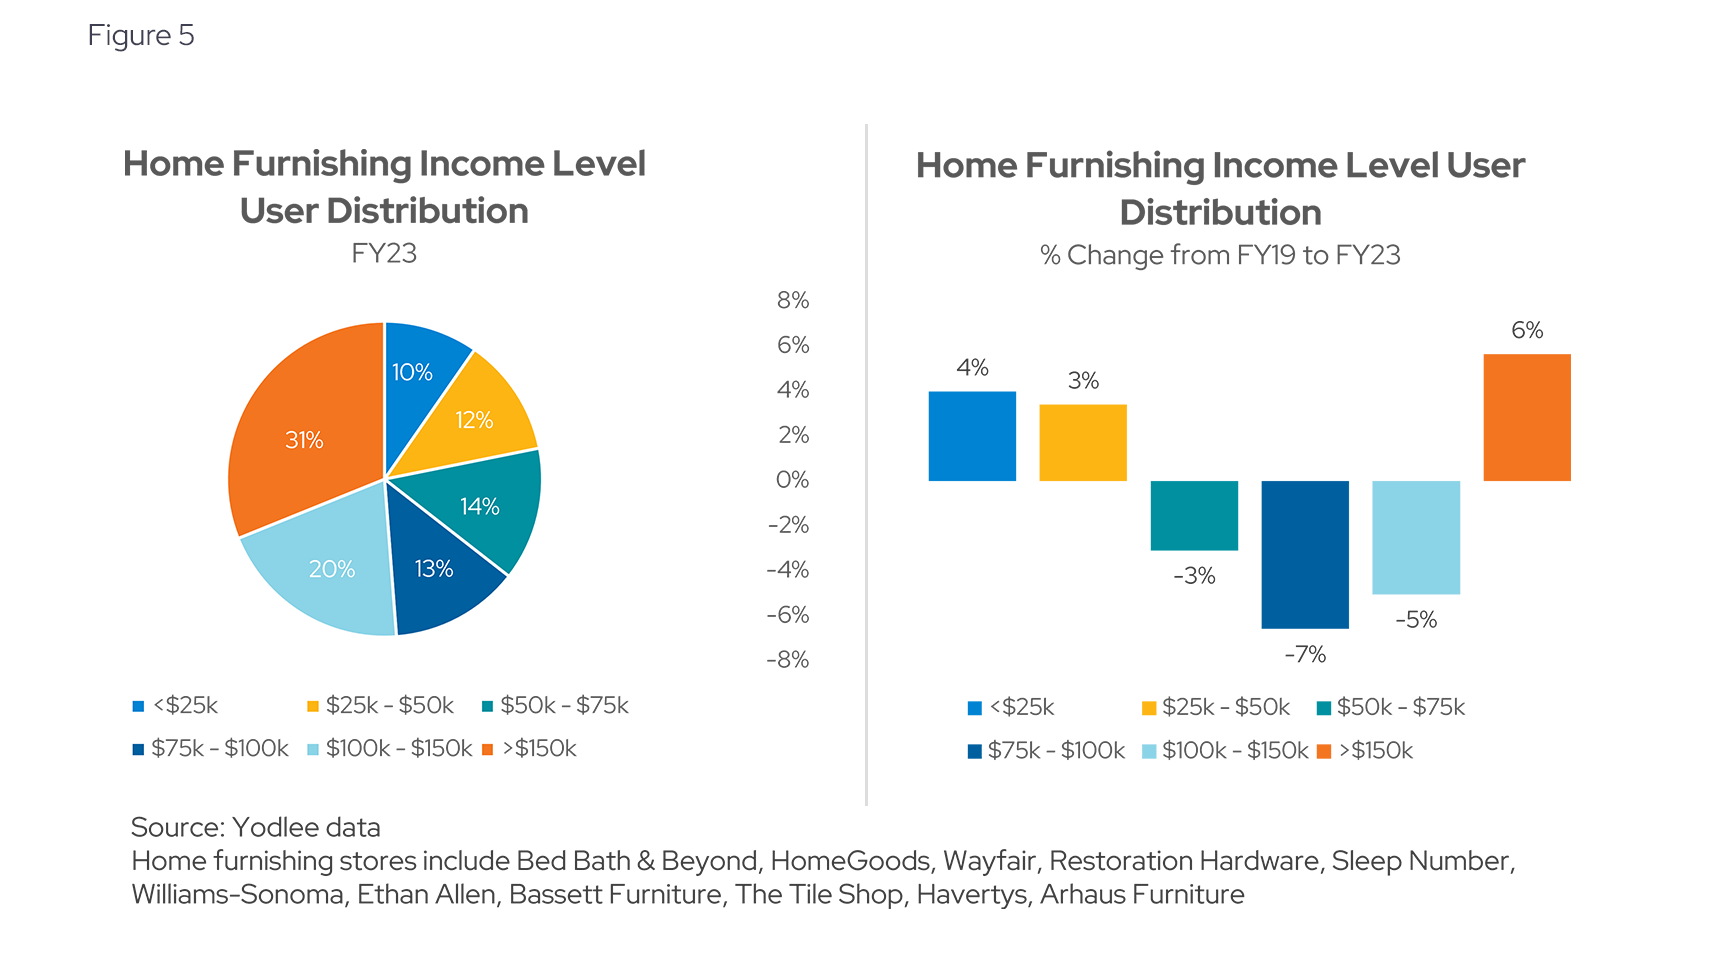
About half of home furnishing users have an income of $100k or more , as illustrated in Figure 5. The highest earners (>$150k) had a 6% increase in spend between 2019 and 2023, while the spend by those in the $100k-$150k income bracket dropped 5% during the same period. Interestingly, the lowest income bracket experienced mid-single digit increases over the time period.
Online home furnishing sales have increased significantly between 2019-2023
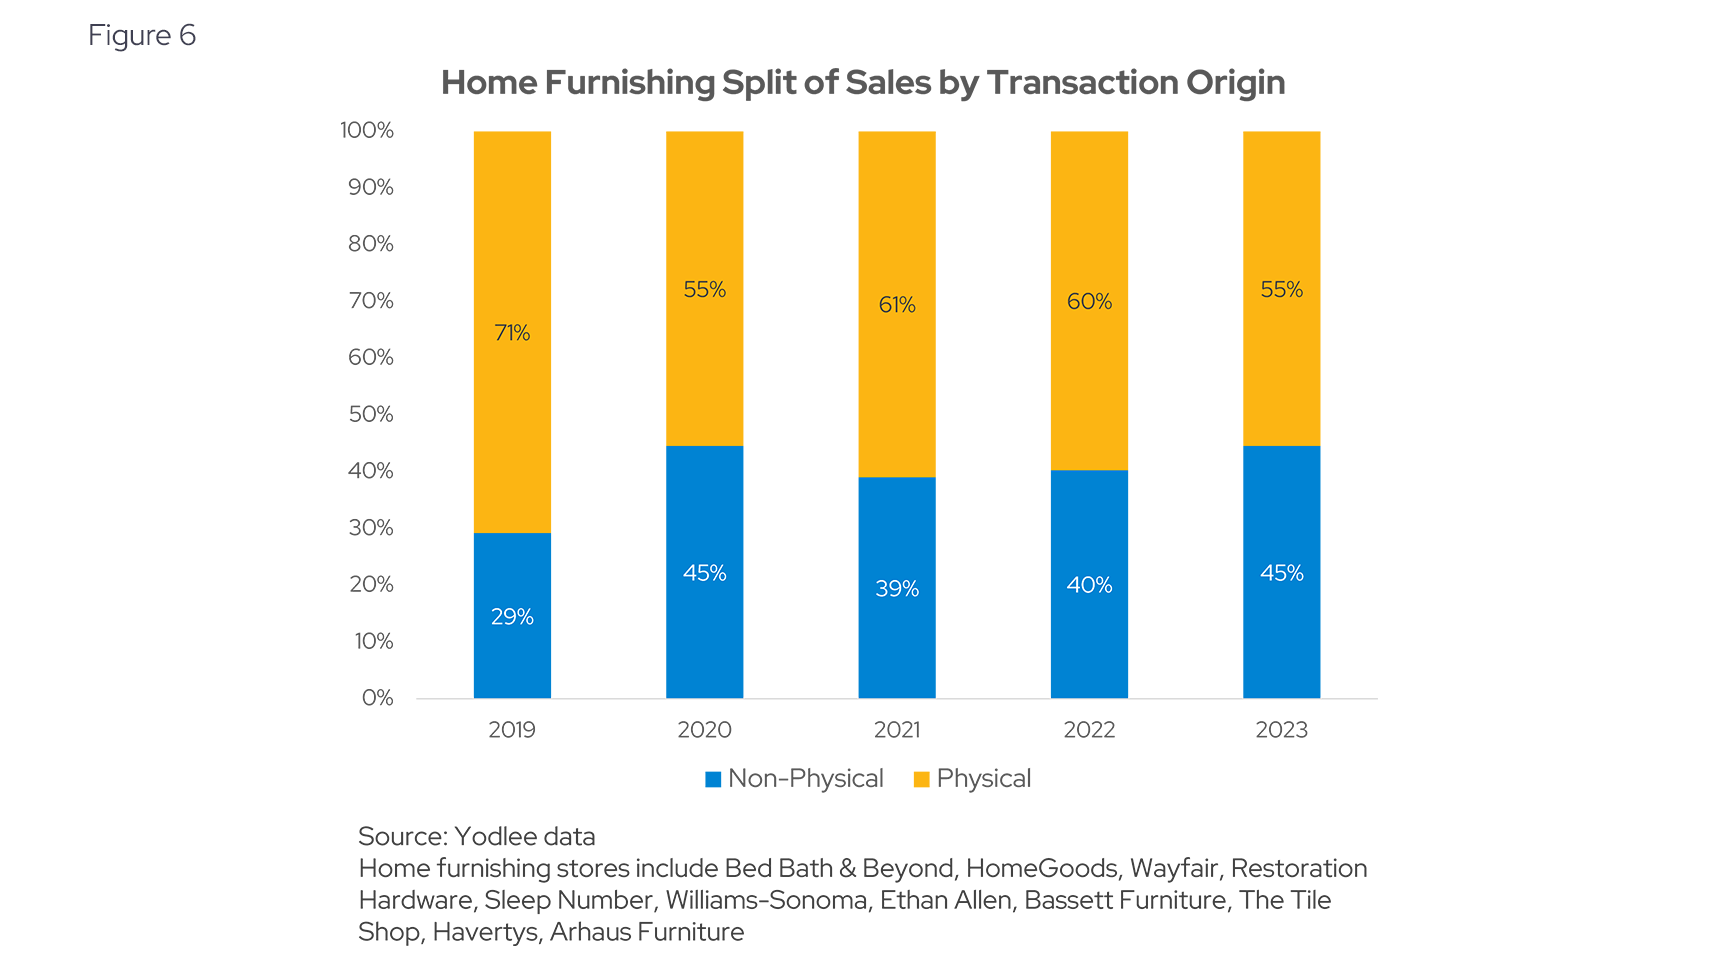
Home furnishing sales have seen a significant shift towards online platforms over the past five years. This suggests that consumers have become increasingly comfortable purchasing furniture online for a variety of reasons. In 2019, online sales accounted for only 29% of all home furnishing transactions. By 2023, this figure had risen to 45%, reflecting a growing trend towards e-commerce in the home furnishing sector (see Figure 6). This shift underscores the evolving consumer behavior and the increasing importance of online retail channels.
Consumers are extremely loyal when it comes to home furnishing
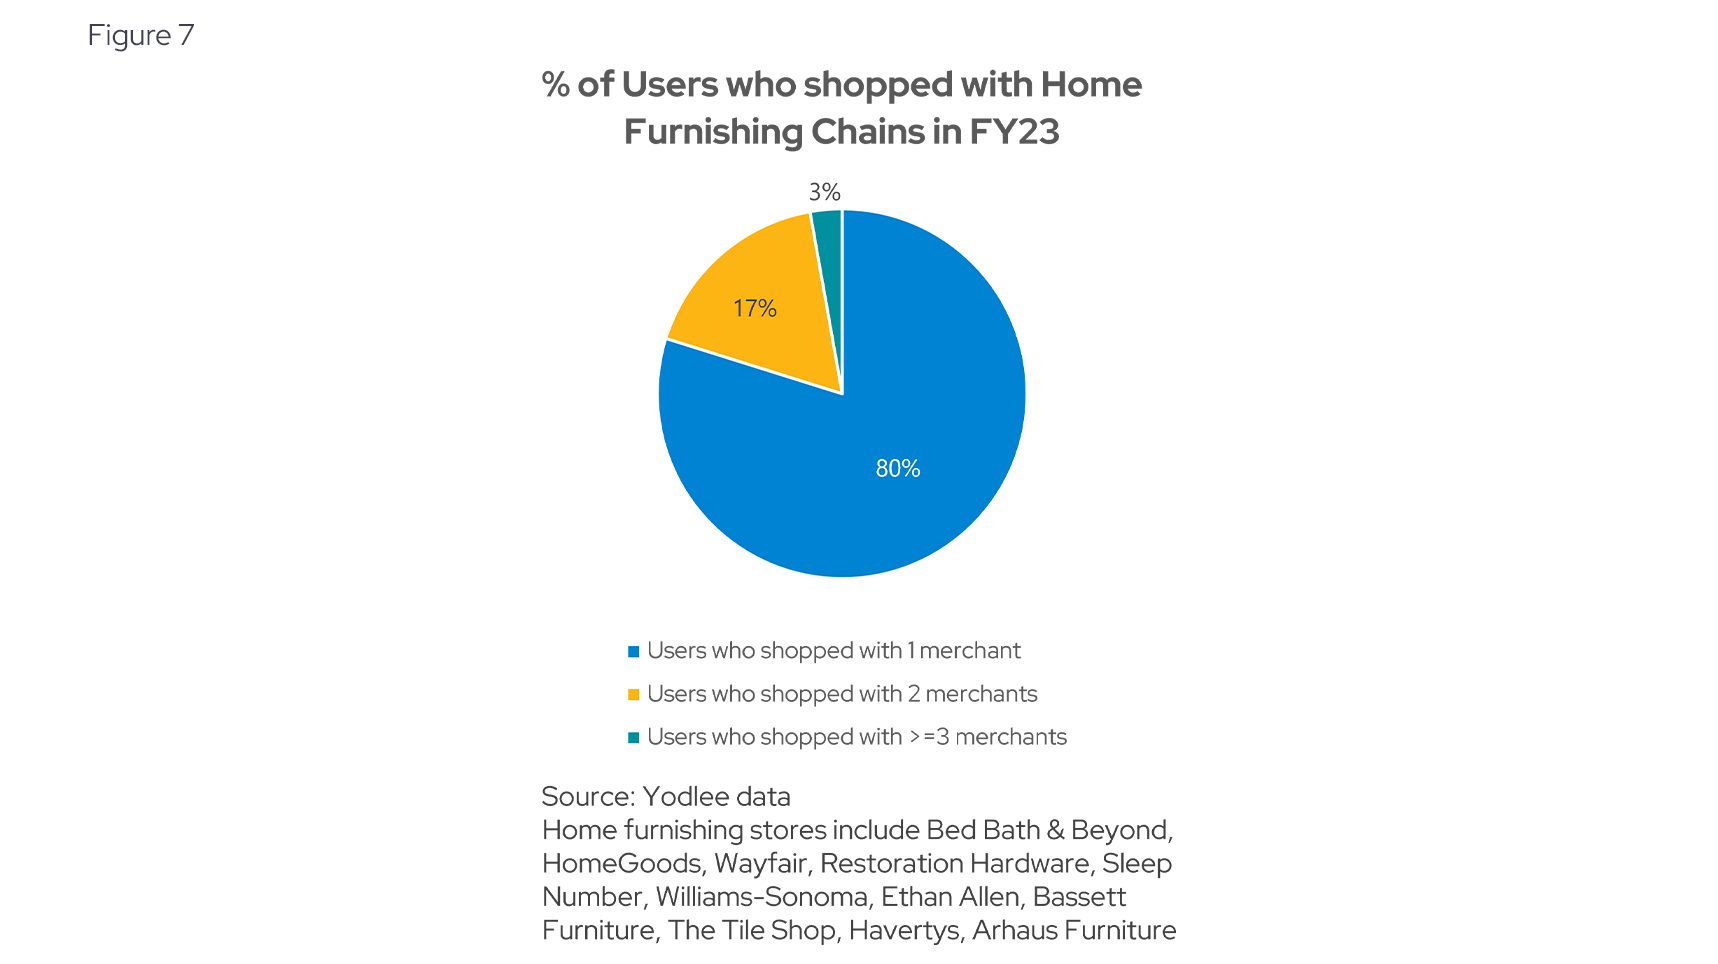
Yodlee data suggests that consumers demonstrate remarkable brand loyalty in the home furnishing sector. Analysis of transactions during 2023 indicates that 80% of users consistently shopped with a single merchant for their home furnishing needs, while only 17% diversified their purchases across two merchants. This high level of loyalty underscores the importance of customer retention strategies for retailers in the industry.
Consistent spending amid market shifts
The home furnishing market has undergone significant shifts, influenced by changing consumer behaviors and economic conditions. As detailed in this post, the market has stabilized following a surge in spending, with major players like Wayfair and HomeGoods capturing significant market shares. The transition of Bed Bath & Beyond to an online-only model has further reshaped the competitive landscape. Despite a decline in overall user numbers, spending per user has remained consistent, indicating robust demand within the sector. The market is increasingly driven by high-income earners, and online sales have seen substantial growth, reflecting the rising comfort of consumers with e-commerce.
The value of transaction data
Analyzing transaction data has proven invaluable in uncovering these trends, providing deep insights into spending patterns and market dynamics. This data not only helps in understanding current consumer behaviors but also in predicting future trends, making it a crucial tool for market researchers, corporate strategists, and investors. For those looking to stay ahead in the home furnishing market, leveraging transaction data can offer a competitive edge and strategic foresight.
Want to get ahead of consumer spending trends?
Subscribe to our research data blog for ongoing updates or reach out for a personalized, up-to-date view of Yodlee consumer spending data.
About Envestnet | Yodlee Merchant, Retail, Shopper, and Spend Insights
Envestnet | Yodlee Merchant, Retail, Shopper, and Spend Insights utilize de-identified transaction data from a diverse and dynamic set of data from millions of accounts to identify patterns and context to inform spending and income trends. The trends reflect analysis and insights from the Envestnet | Yodlee data analysis team. By combining data with intelligence – connecting vast amounts of actual de-identified shopping data with state-of-the-art analytics and machine learning – Envestnet | Yodlee provides visibility into a large set of shopping daily purchase behavior including, but not limited to, transactions, customer lifetime values, and merchant/retailer shares.
To learn more about Envestnet | Yodlee Merchant and Retail Insights and get a free demo, please contact an Envestnet | Yodlee sales representative.