In our recent review of retail spending trends, we observed that home improvement spending has remained elevated post the COVID lockdown due to the ongoing demand for DIY projects and renovation products. Spending in this category spiked during the pandemic but growth has slowed over the past few years as workers return to the office and home sales slow.
This article delves into the home improvement sector, focusing on major brands like Home Depot (HD) and Lowe's (LOW). Utilizing Envestnet® | Yodlee®'s extensive collection of de-identified retail transaction data, we uncover how spending patterns have evolved and trended post-COVID.
Spending at home improvement chains remains relatively unchanged in recent quarters
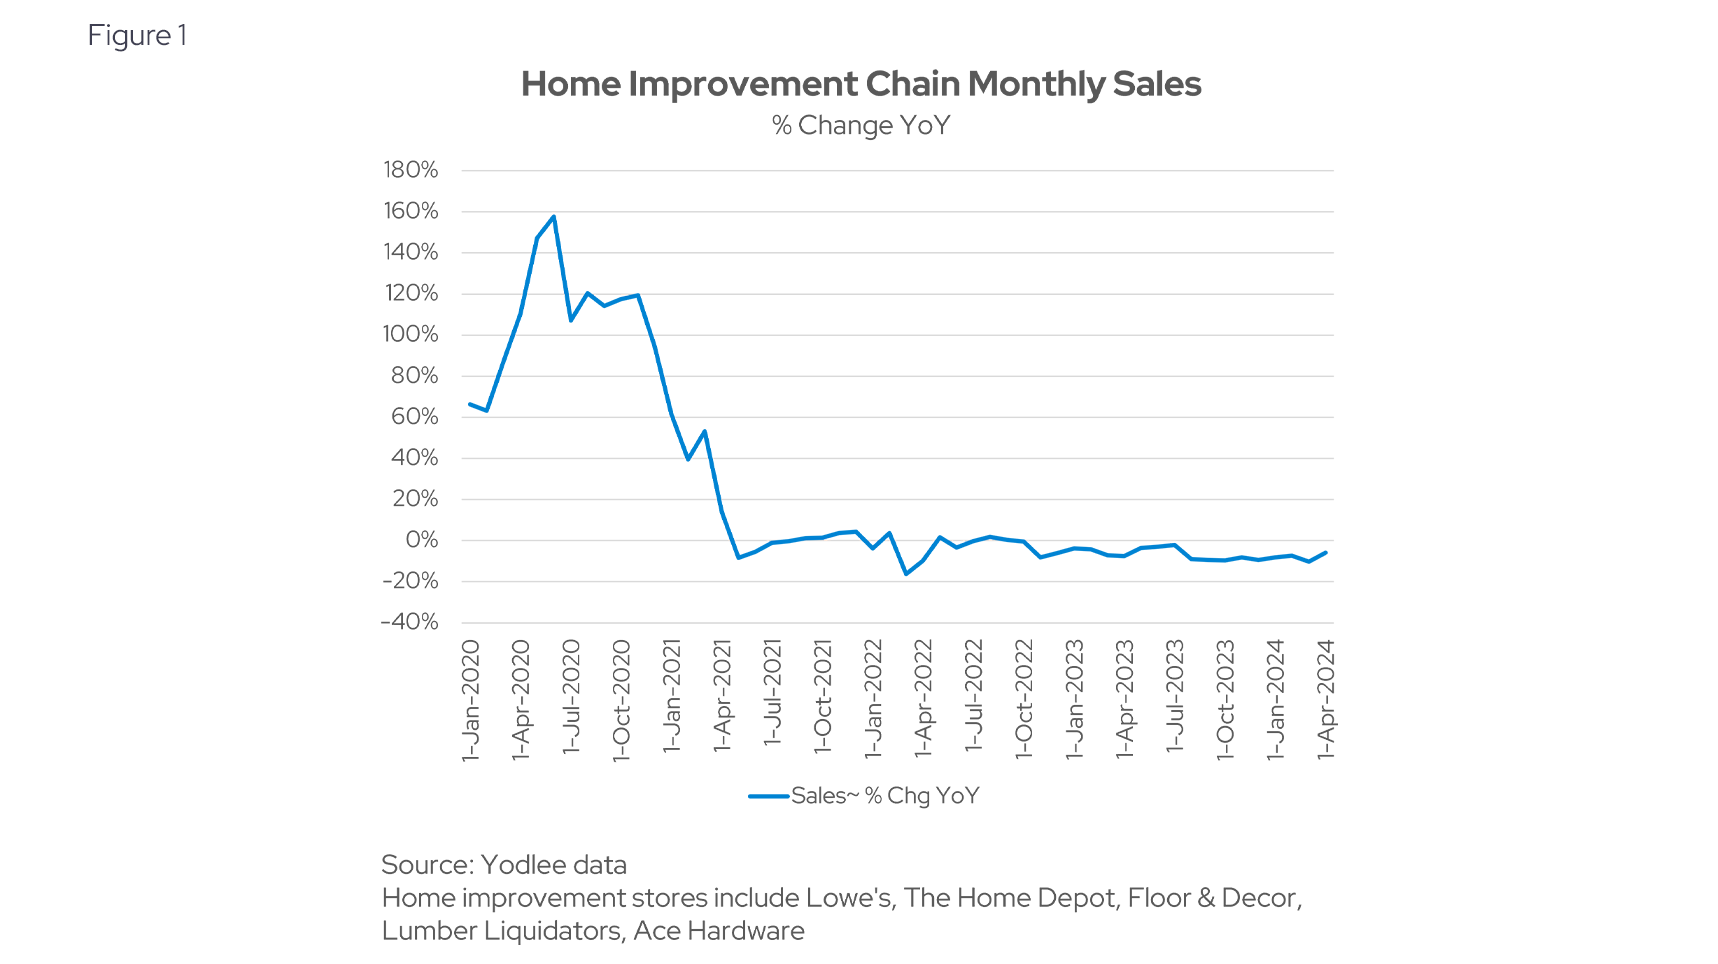
Yodlee data shows that home improvement spending spiked during COVID then moderated throughout 2021 given the higher comparison in 2020 (see Figure 1). Spending in this segment has trended fairly consistently over the past two years. A recent Forbes article suggests that home renovation spending is expected to decrease from $486 billion to $457 billion in 2024. The main driving factors of this decrease include high and rising interest rates, slower growth in house price appreciation and a decrease in home sales.
Home Depot and Lowes’ comprise 90%+ of market share
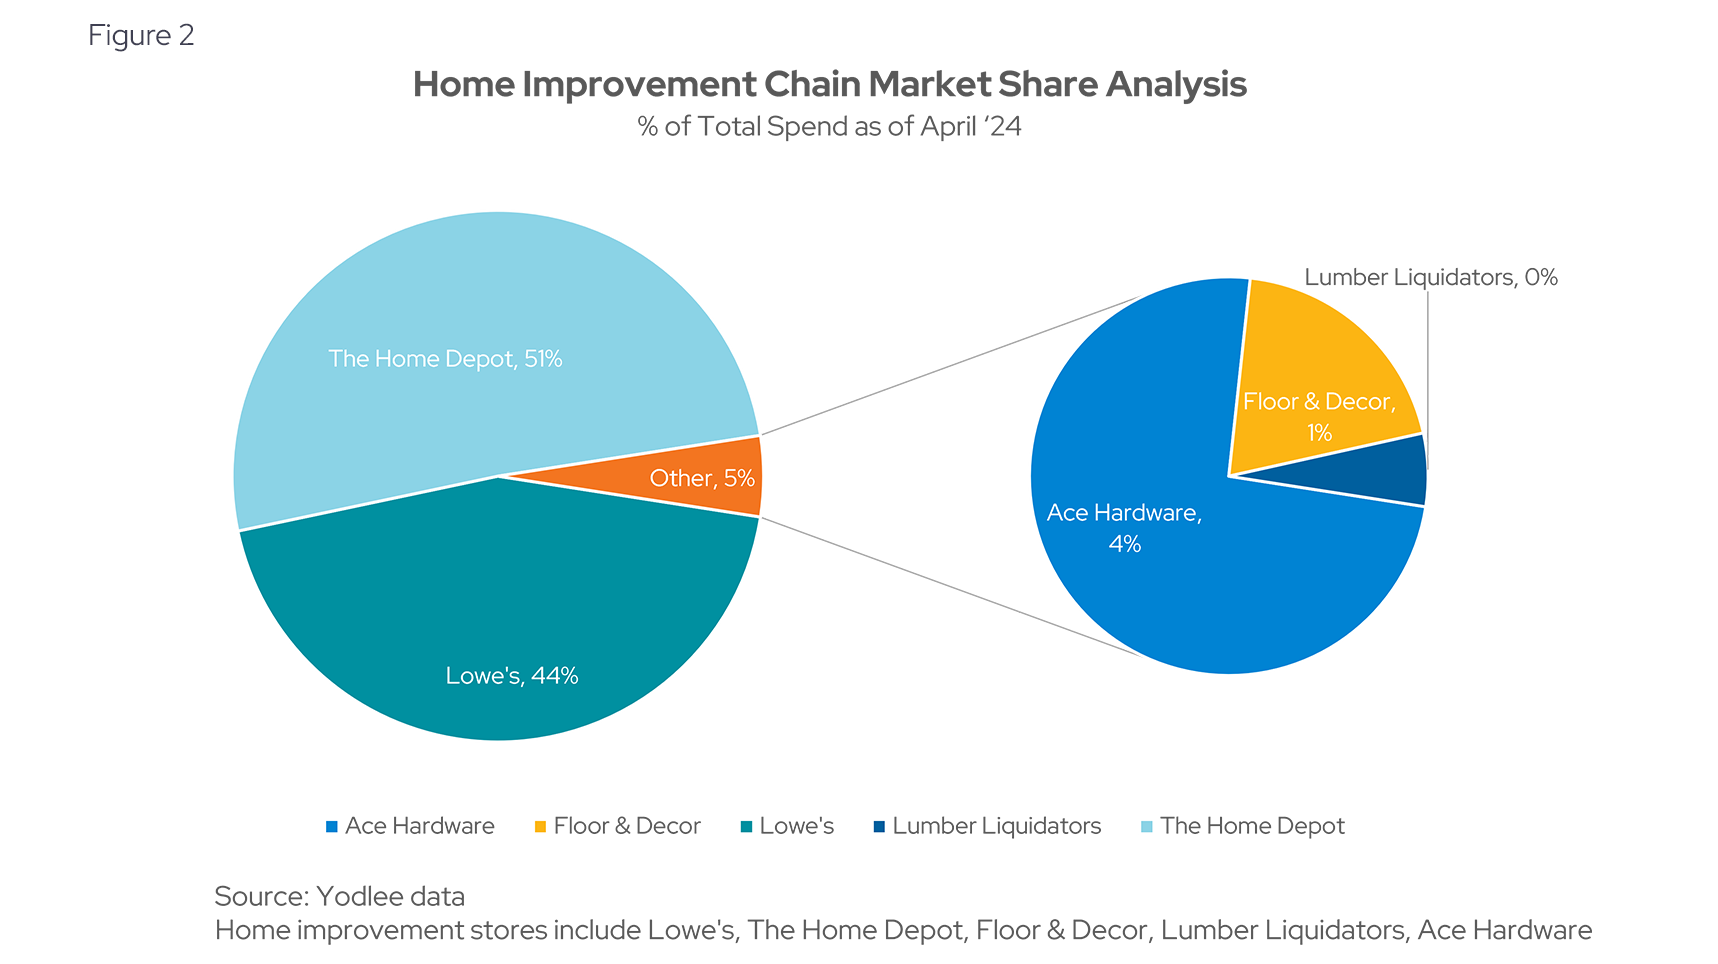
Comparing the spend for home improvement chains that have similar offerings, Yodlee data indicates that Home Depot and Lowes’ are the market giants (see Figure 2). Both chains have diversified spending categories, including major home renovations, gardening, home décor and DIY projects.
Number of Users and Spend per User is Stable
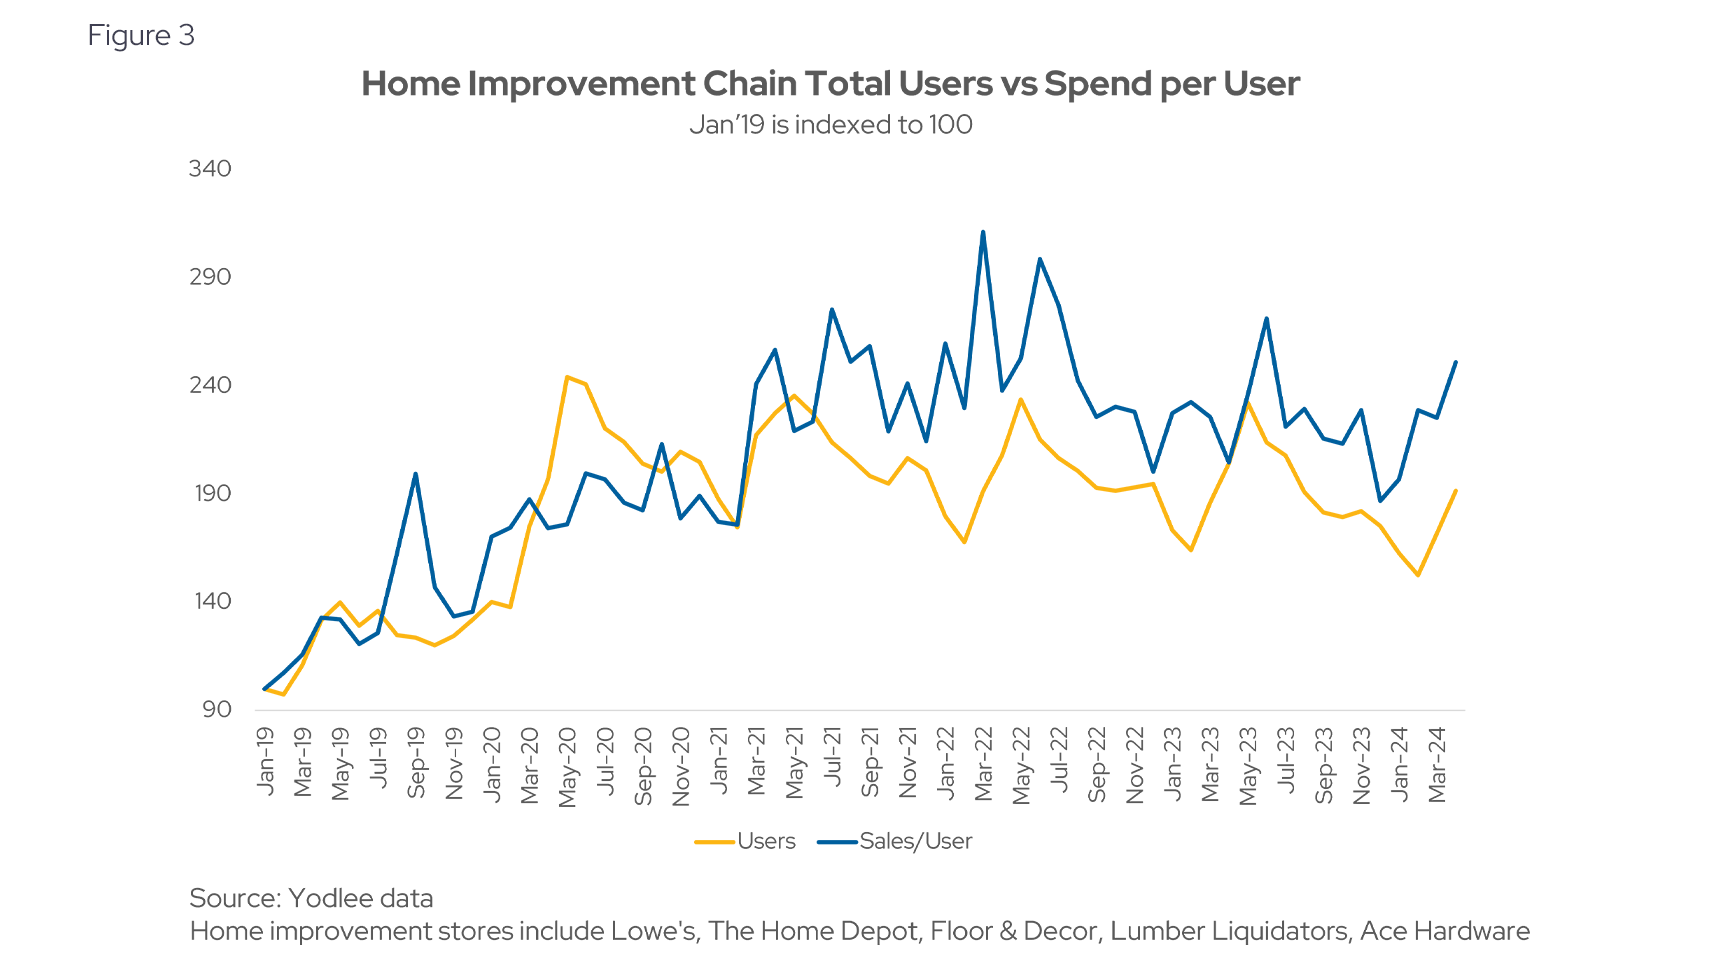
Yodlee data shows that the growth of both the number of users and sales per user in the home improvement sector have been relatively rangebound post-COVID, remaining above 2019 levels (see Figure 3). This sustained growth reflects a lasting shift in consumer priorities towards home improvement, driven by increased time spent at home and a continued focus on enhancing living spaces.
Average transaction size has been volatile since January 2020
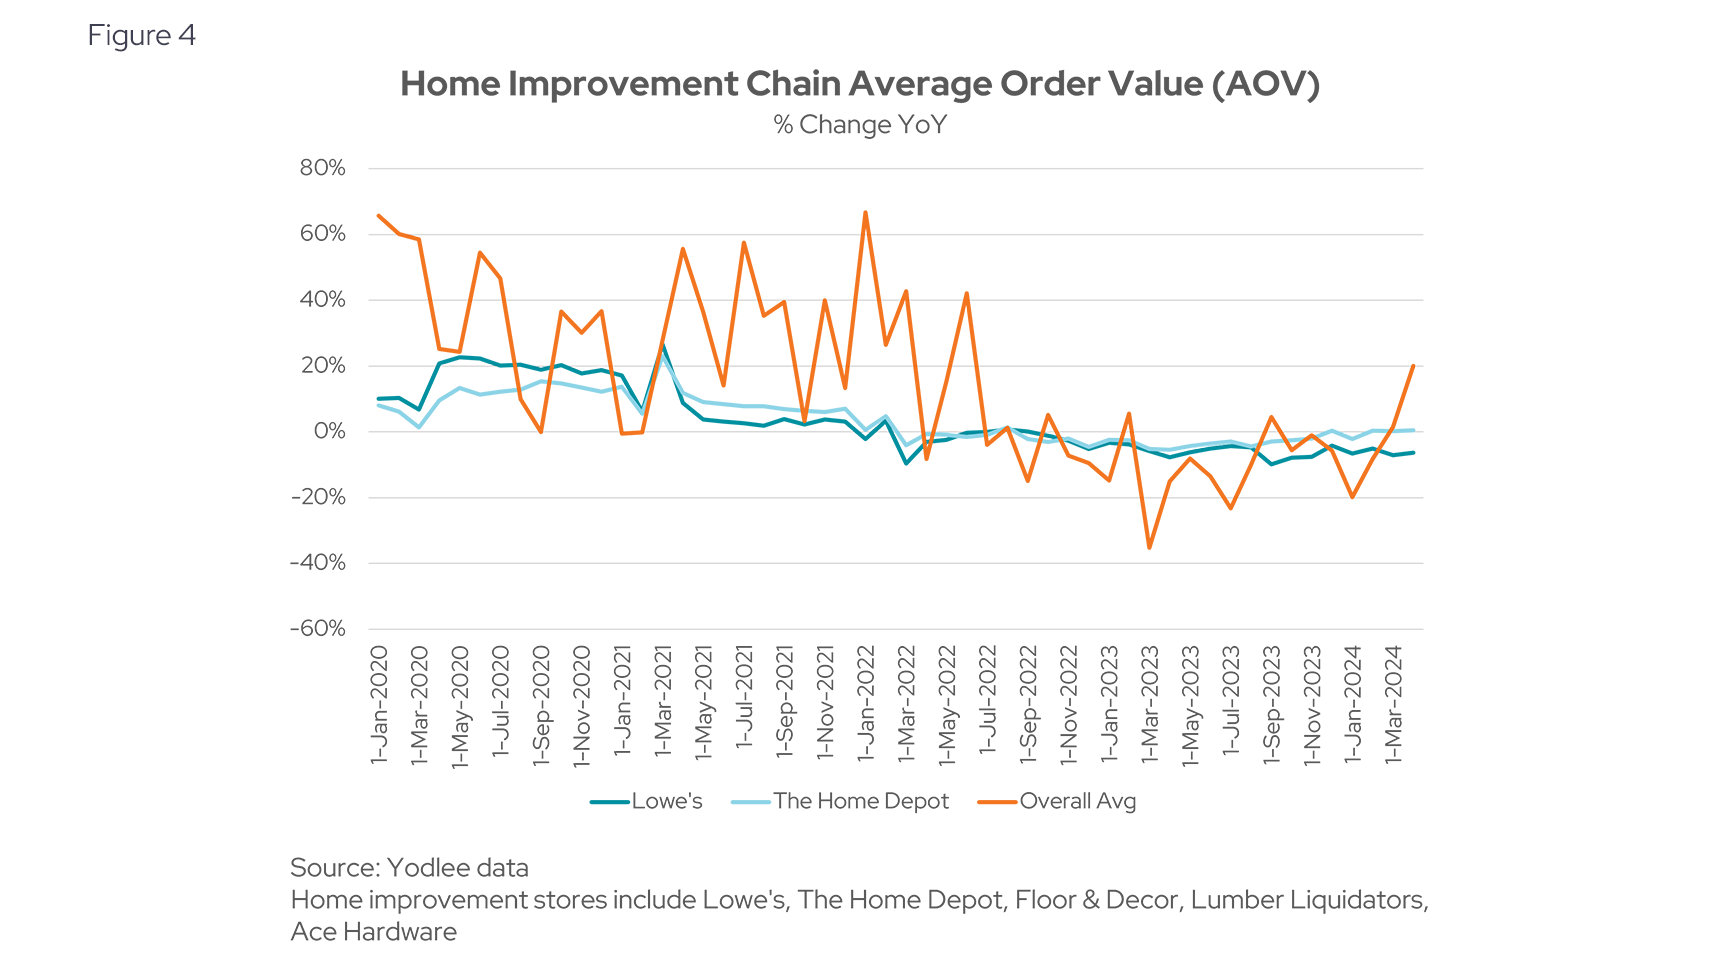
Figure 4 illustrates that the average order value (AOV) for Home Depot remained consistent compared to last year, while Lowe's experienced a slight year-over-year decline. Over the past three years, the overall average AOV has shown fluctuations, likely influenced by seasonal trends and changes in consumer spending patterns throughout the year.
User percentages are highest in top income bracket, decline with lower incomes
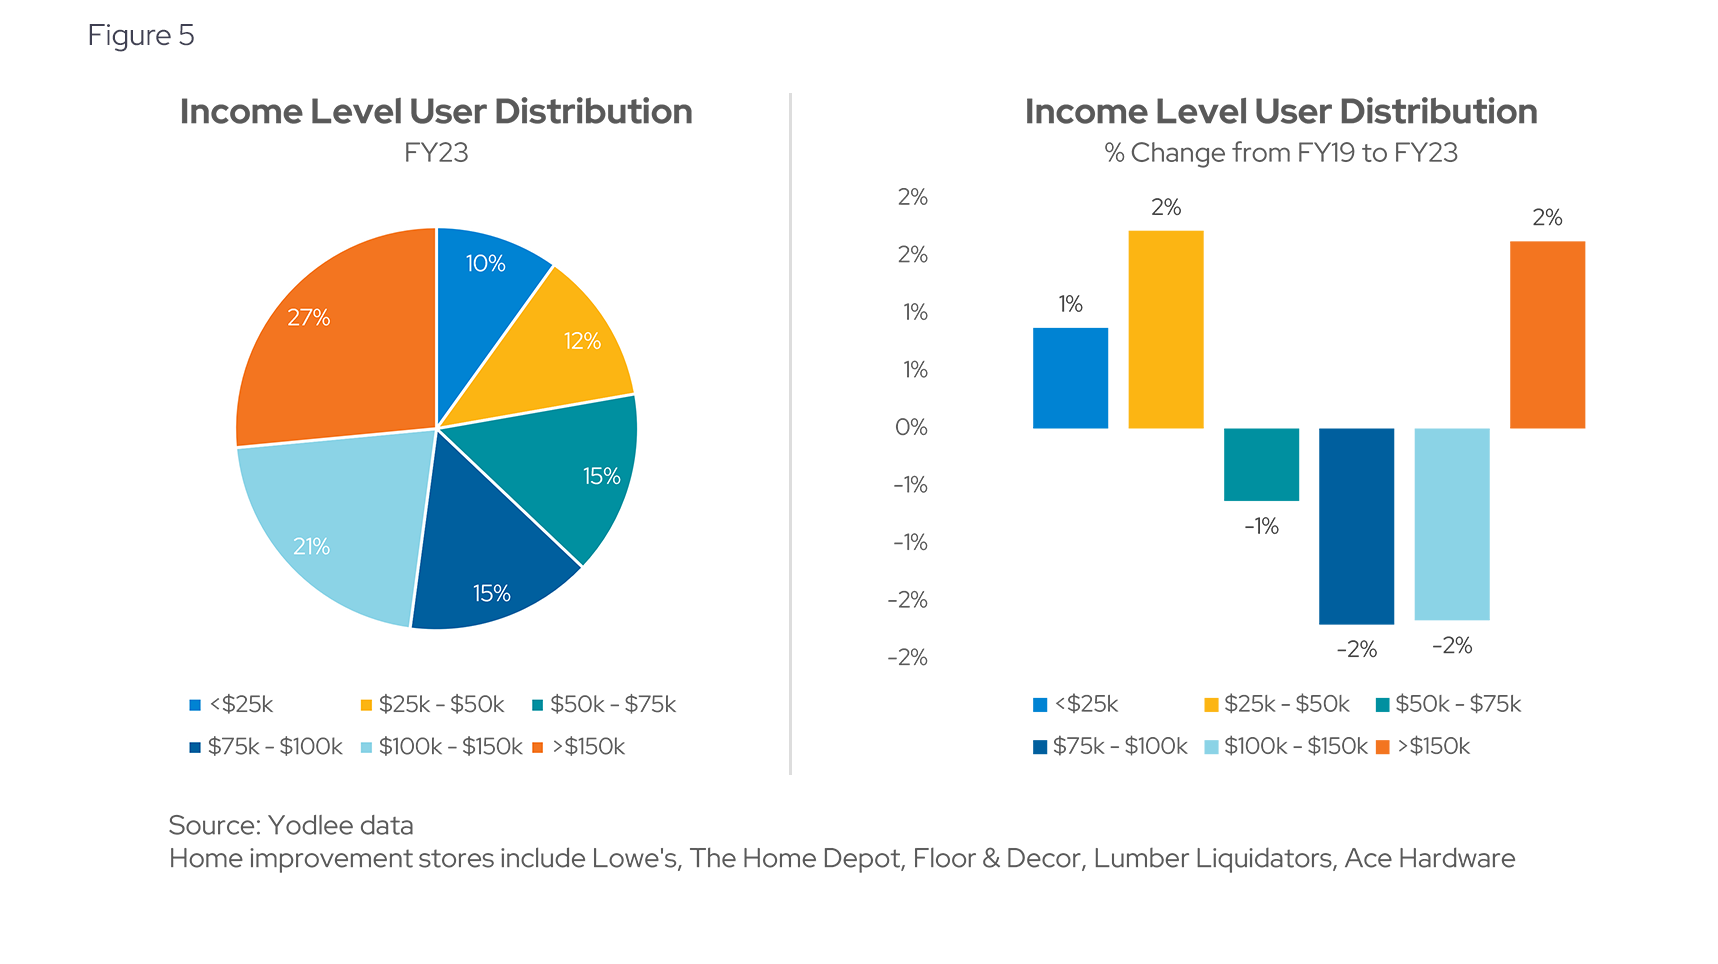
Figure 5 provides a detailed breakdown of home improvement users by income level. The left side of the figure shows that the highest income group (>$150k) comprises the largest segment of users at 27%, while the lowest income group (<$25k) makes up the smallest segment at 10%. The right side of Figure 5 reveals a decline in the proportion of users within the three middle income groups ($50k-$150k) from 2019 to 2023, suggesting a shift in spending patterns among these consumers.
Physical sales far outpace online sales
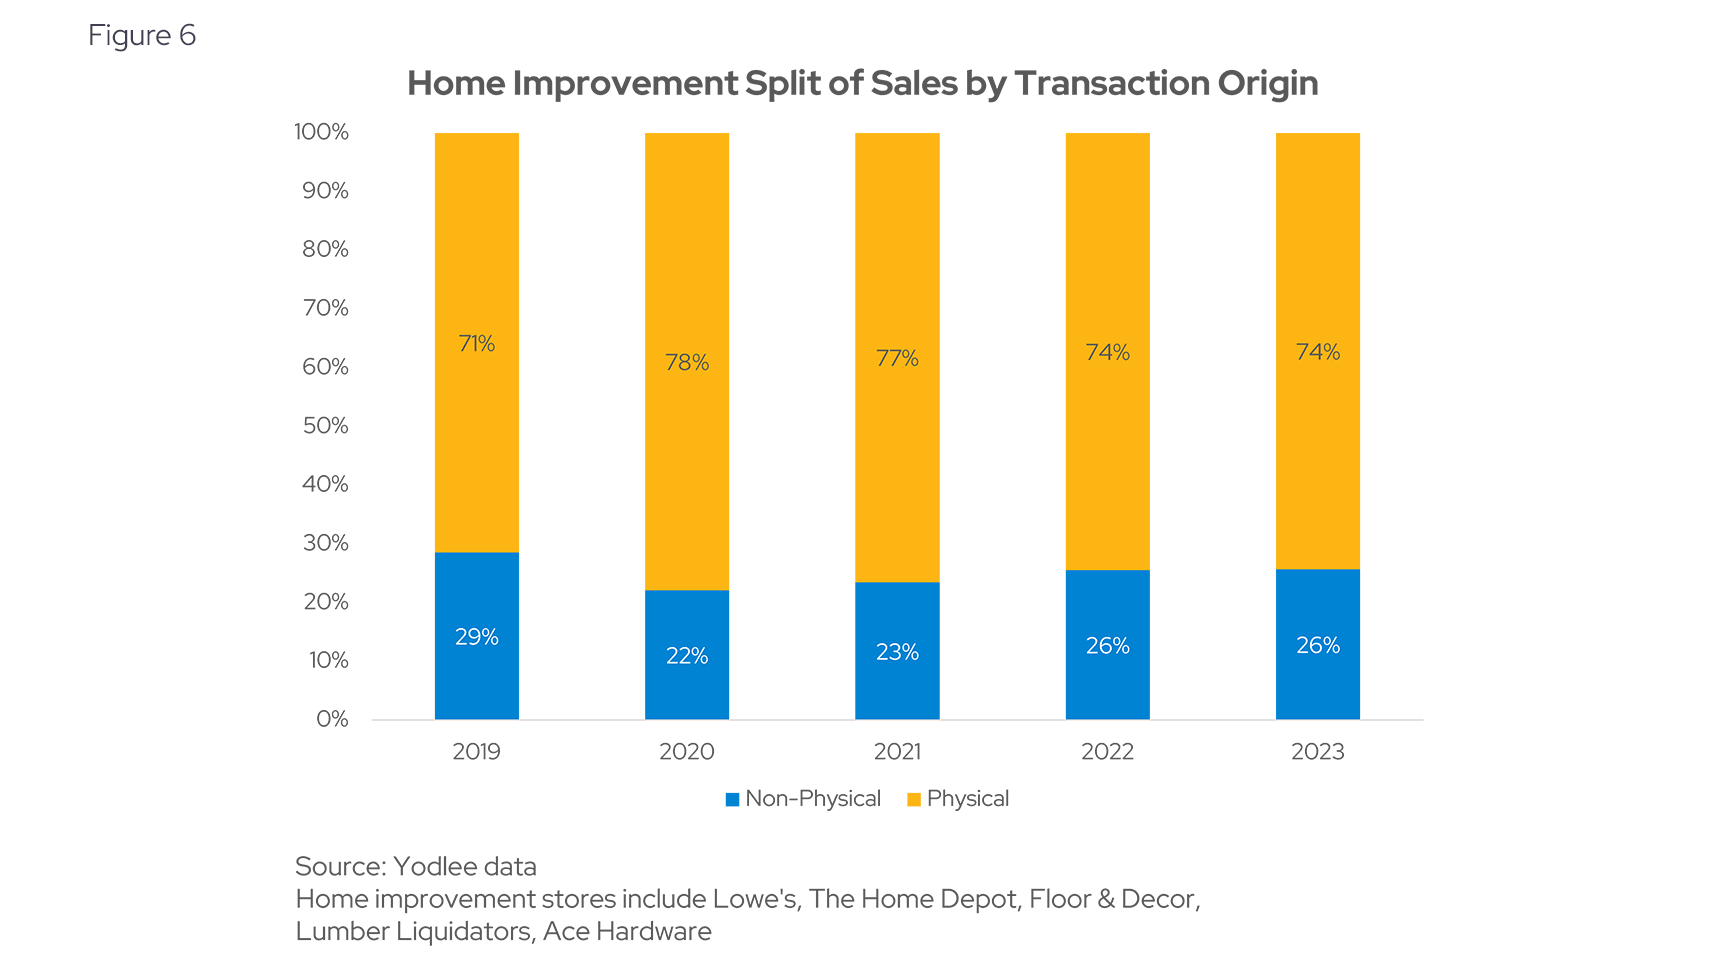
Despite the rise in e-commerce, physical sales continue to dominate the home improvement sector, accounting for 74% of total sales in 2023 (see Figure 6).
Majority of consumers show loyalty to one or two home improvement chains
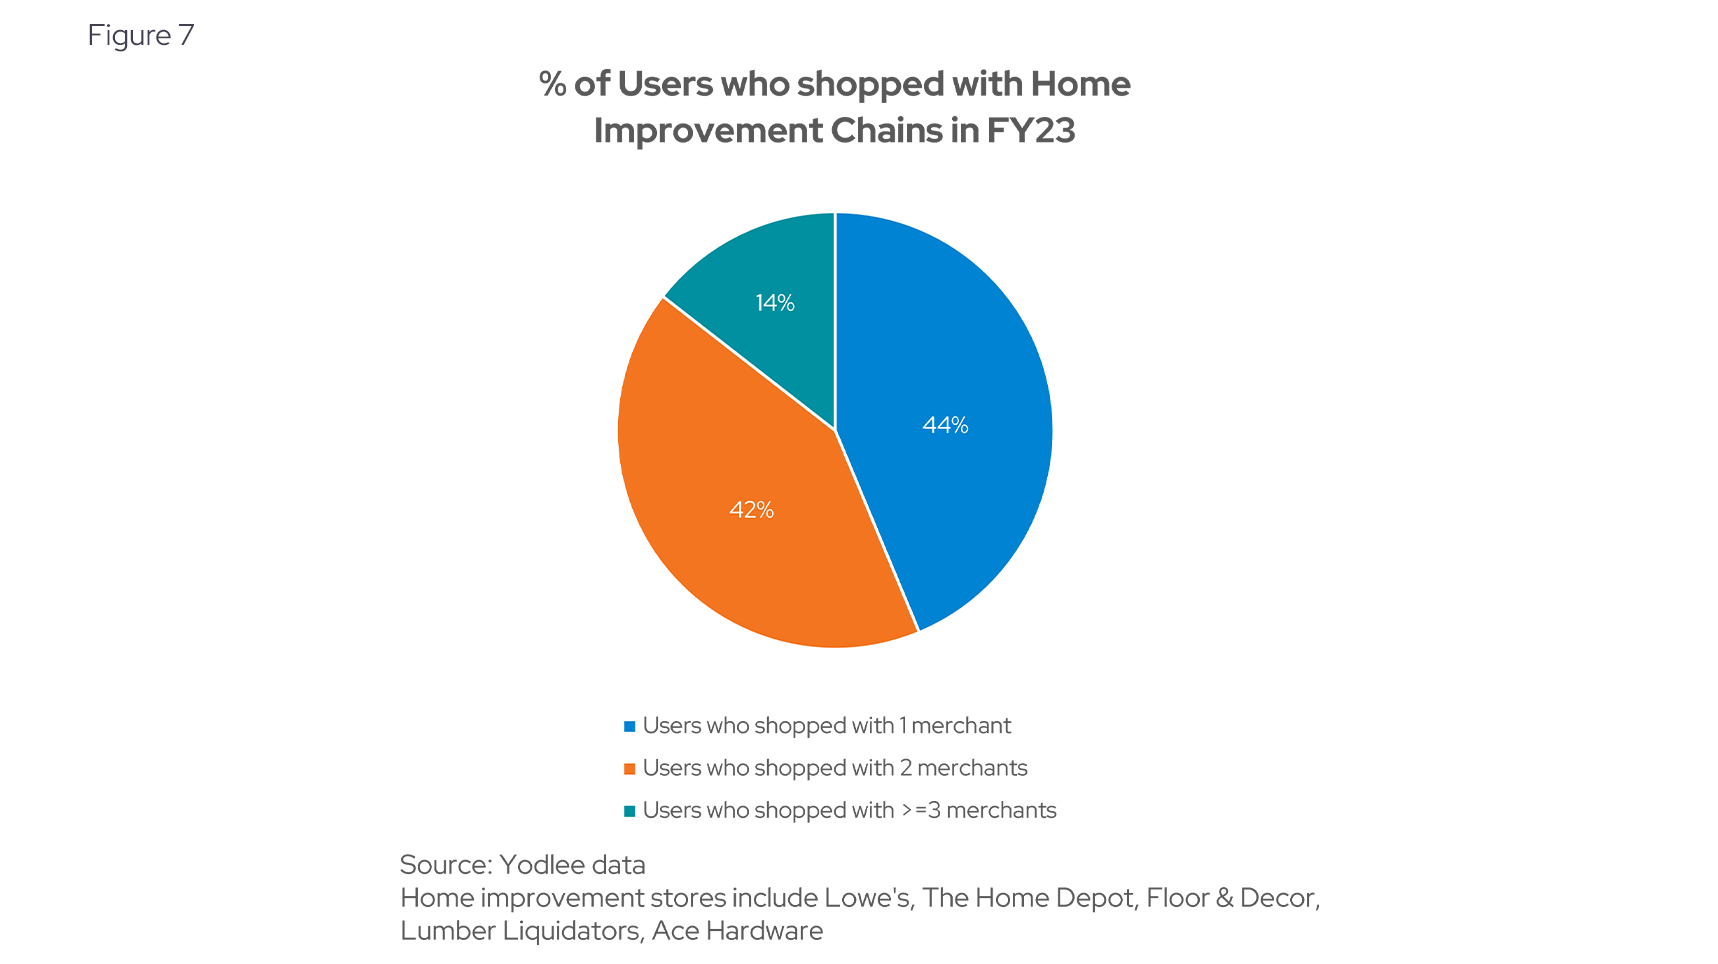
Figure 7 highlights customer loyalty within the home improvement sector by showing the percentage of users shopping at multiple chains. In 2023, 44% of users demonstrated strong loyalty by shopping exclusively at one home improvement merchant. This was closely followed by 42% of users who shopped at two different chains, indicating a moderate level of brand switching. Meanwhile, only 14% of users spread their purchases across three or more chains.
Sustained growth and stability in home improvement
The home improvement sector has shown remarkable resilience and stability, with user engagement and spending patterns maintaining levels above those seen in 2019. This sustained growth highlights the lasting impact of increased time spent at home and a continued focus on enhancing living spaces. Transaction data, as provided by Envestnet | Yodlee, proves invaluable in capturing these trends, offering critical insights that can help businesses and analysts navigate the evolving retail landscape.
Want to get ahead of consumer spending trends?
Subscribe to our research data blog for ongoing updates or reach out for a personalized, up-to-date view of Yodlee consumer spending data.
About Envestnet | Yodlee Merchant, Retail, Shopper, and Spend Insights
Envestnet | Yodlee Merchant, Retail, Shopper, and Spend Insights utilize de-identified transaction data from a diverse and dynamic set of data from millions of accounts to identify patterns and context to inform spending and income trends. The trends reflect analysis and insights from the Envestnet | Yodlee data analysis team. By combining data with intelligence – connecting vast amounts of actual de-identified shopping data with state-of-the-art analytics and machine learning – Envestnet | Yodlee provides visibility into a large set of shopping daily purchase behavior including, but not limited to, transactions, customer lifetime values, and merchant/retailer shares.
To learn more about Envestnet | Yodlee Merchant and Retail Insights and get a free demo, please contact an Envestnet | Yodlee sales representative.