Consumer spending on furniture in the US has taken a noticeable turn since the peak of the pandemic. While COVID-19 sparked a surge in home-focused purchases, recent trends suggest spending in this category has cooled and may be stabilizing at levels below those highs.
Drawing on Envestnet®| Yodlee®’s de-identified transaction data, our analysis explores shifts across online sales, market share, brand loyalty, transaction counts, and average order values (AOV) in a selection of 13 prominent brands. These include well-known names spanning online, value, traditional, and luxury categories, such as Wayfair (W), Restoration Hardware (RH), Arhaus (ARHS), Pottery Barn (WSM), IKEA, The Container Store (TCS), Bassett Furniture (BSET), LoveSac (LOVE), and Overstock.com.
Post-Pandemic Dip: Furniture Spending Stabilizes Below Peak
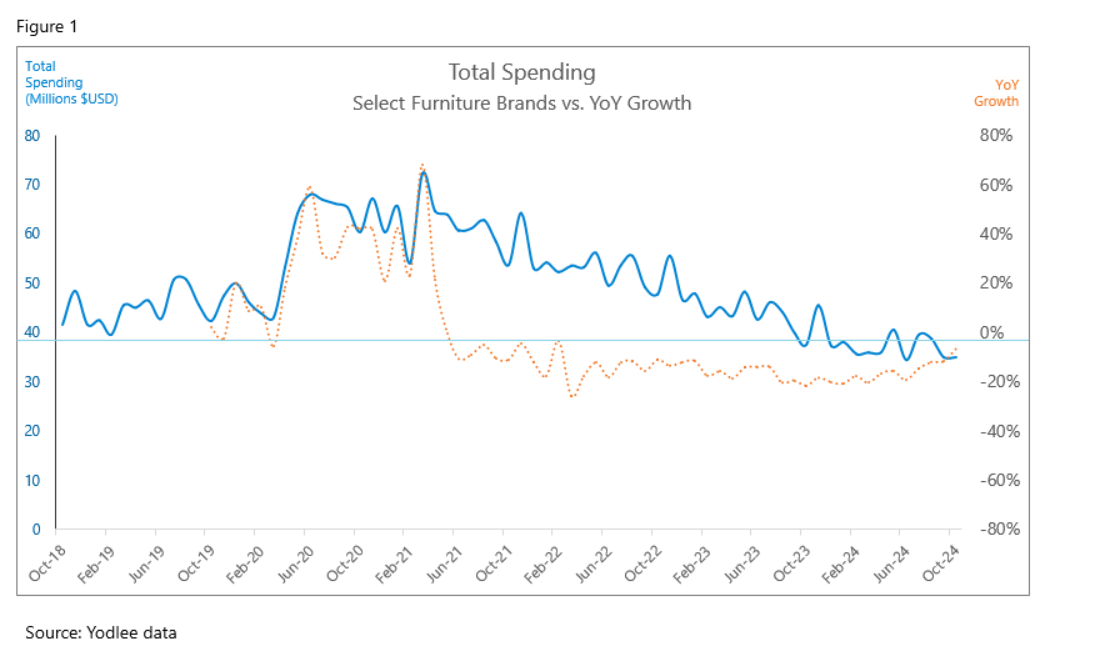
Yodlee data across our select group of furniture brands suggests a surge in demand during the pandemic, peaking in 2021, followed by a steady deceleration (Figure 1). While insights indicate that this slowdown may be stabilizing, current spending levels appear to remain near or just below pre-COVID figures. Forbes also reported on COVID-era furniture retailer growth.
According to the Wall Street Journal, one key factor may be ongoing housing market stagnation. With home sales on track for the worst two years since the mid-90s, there appears to be a corresponding decline in furniture purchases. The article also explores the possible influence of a one-time spike in purchases made for home offices during the remote-work boom. CNBC reports that inflation still poses problems for consumer spending.
For investors closely monitoring data for signs of recovery in durable goods spending, such as furniture, Yodlee data suggests that while spending levels have stabilized, cumulative growth in the sector is not apparent.
Growth Slows Across Categories, but Decline Eases
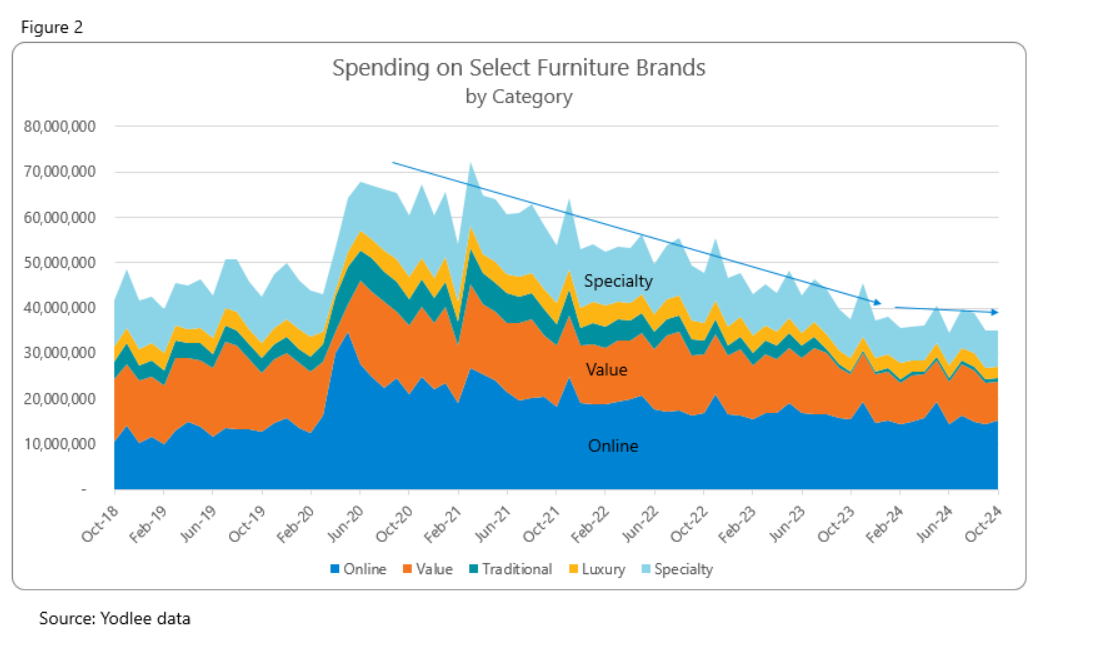
Our analysis looked across online, value, traditional, luxury, and specialty categories. Online spending-focused furniture retailers account for roughly 40% of the group we analyzed, covering companies like Wayfair (W) and Overstock.com (BYON) (Figure 2). Yodlee data suggests consumer spending decline over the past four years for most categories and a slowing rate of deceleration The exception appears to be online—showing a possible shift towards online shopping.
Online Furniture Sales Capture Growing Share of Wallet
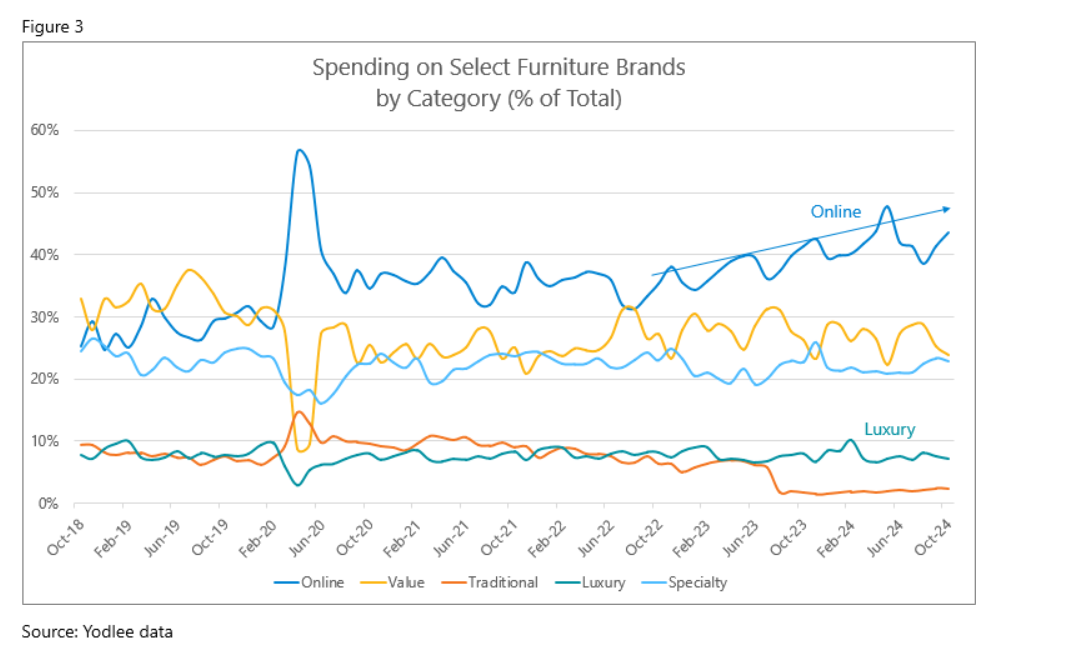
In our group of furniture retailers, pure online sales appear to experience continued growth in their share of spending since October 2023 (Figure 3). Wayfair was the main driver of this trend and appears to have increased its share as a percentage of total wallet, possibly suggesting more stability in spending patterns than the rest of the group.
Wallet Share Tug-of-War
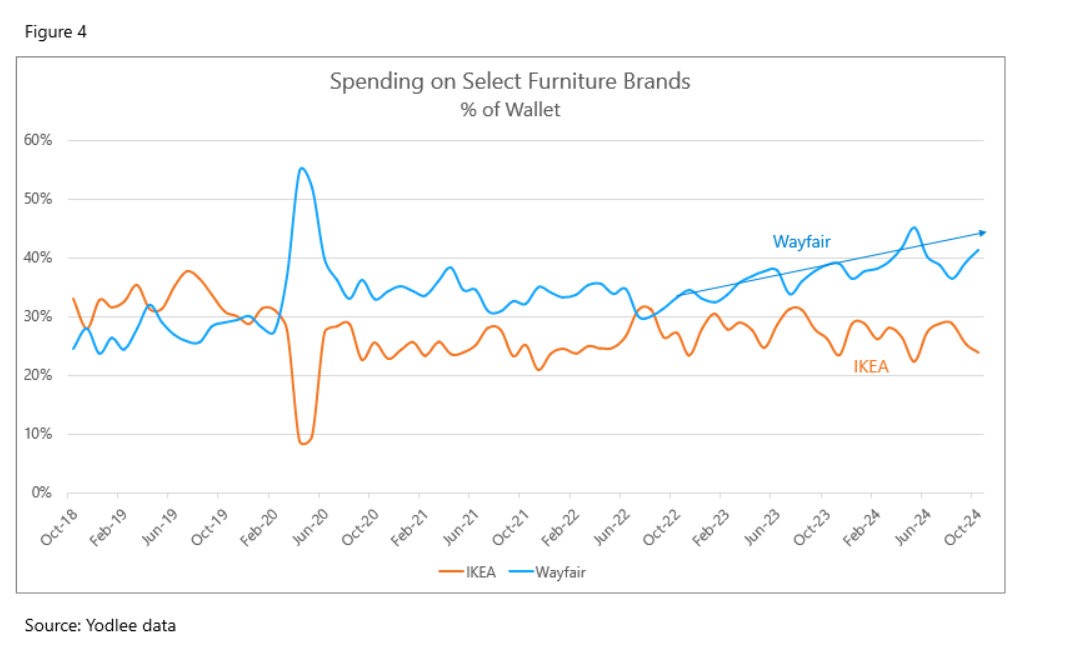
Given the apparent absence of data suggesting industry growth, it might be understood that for a player like Wayfair to hold market share, it could come at the expense of other brands losing market share. This data compares the percent of total wallet trends held by Wayfair compared to incumbents such as Ikea (Figure 4).
Wayfair’s Slice: Comparing Spend and Unique Customer Reach
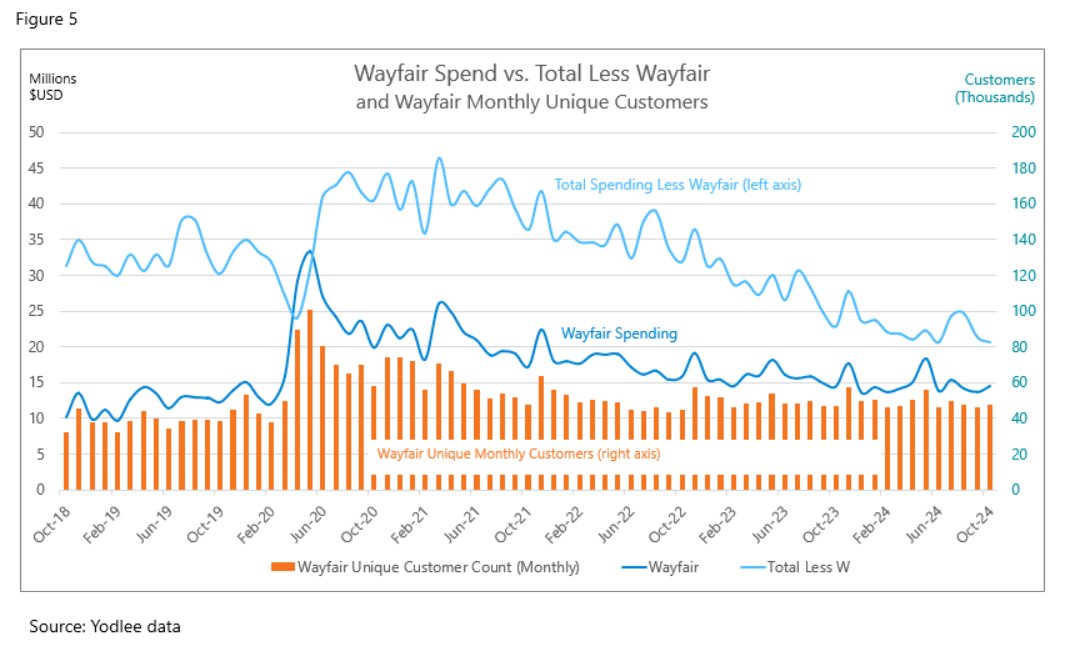
Taking a closer look at Wayfair, the data suggests market share growth during the pandemic lockdown and the ability to hold and build on that lead (Figure 5). Despite exceeding profit estimates, the apparent decline in customer counts influenced Wayfair stock fluctuations. Yodlee data also suggests a small decline in monthly unique customers since the summer and flat year-over-year.
Luxury Brands Face Headwinds Despite Loyal Base
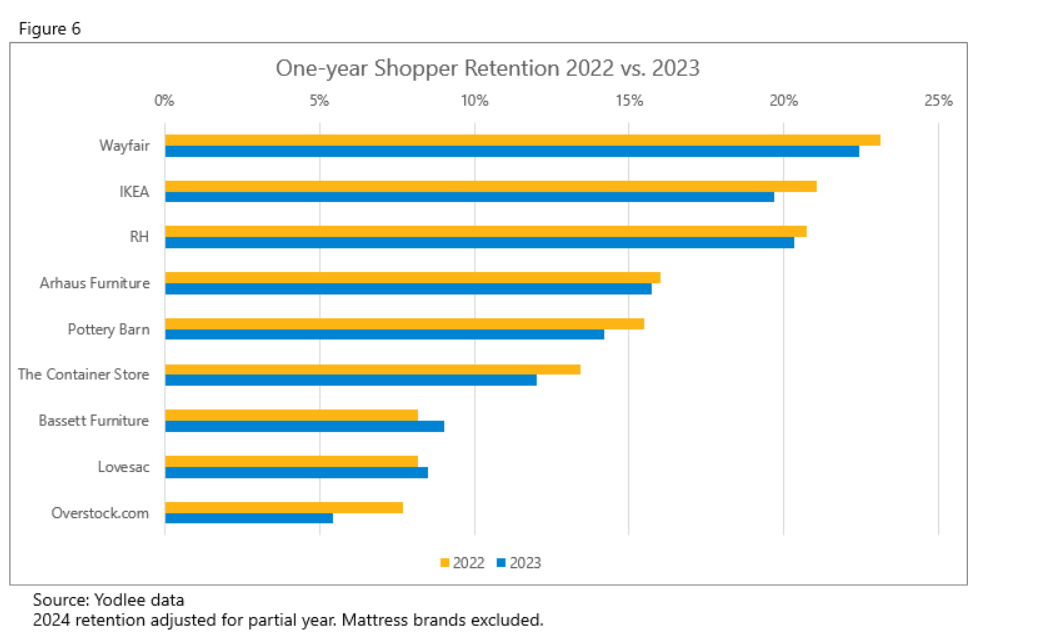
Data on brands perceived as luxury, such as Restoration Hardware and Arhaus Furniture, suggests a struggle to grow their share of wallet (Figure 6). Shares appear to have fallen from 10% of total spending in January to 7% in October of 2024. The deceleration trend in the luxury segment appears slightly faster than the rest of the industry. It’s possible this is connected to slowing home sales.
At the same time, our data suggests that luxury brands appear to have loyal customers. On average, shoppers may have returned to these brands more frequently than traditional brands. Restoration Hardware seems to have performed better than Arhaus with 21% of their shoppers making a second purchase within the 12-month period following an initial purchase (see Figure 6).
Mixed AOV and Transaction Performance: Some Climbs and Some Slips
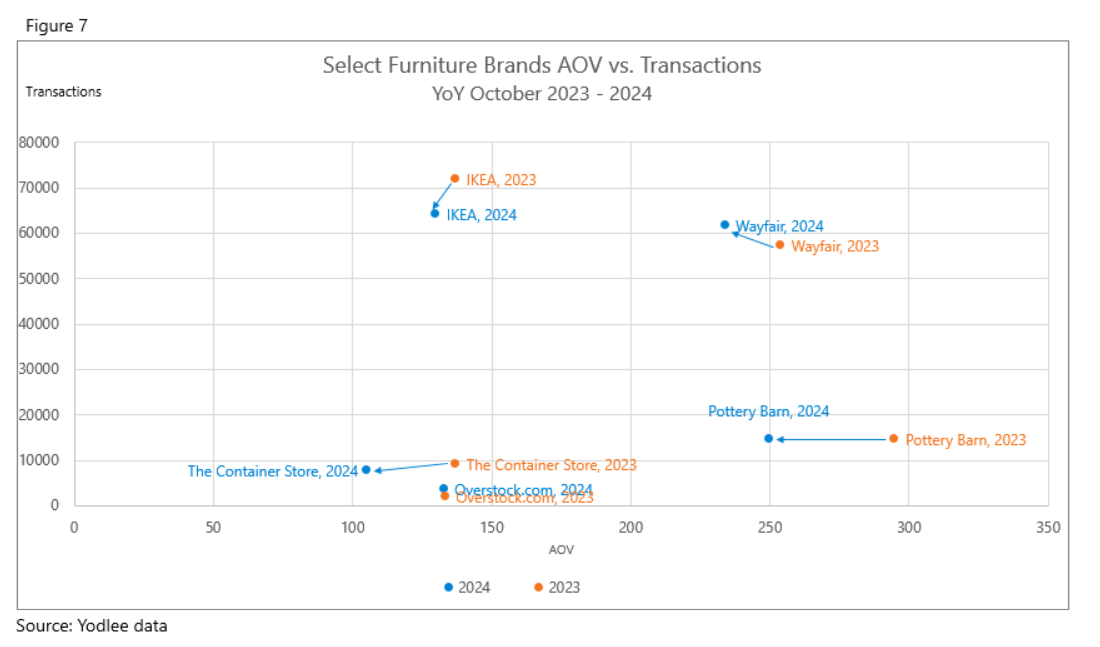
While retention is important, brands need to attract more new customers or keep their AOVs high in order to grow revenues. Yet, recently, the number of unique monthly customers have declined (see Figure 7). Taking this in combination with good retention rates implies that while existing customers are coming back, attracting new shoppers remains a challenge.
Mixed Signals in Furniture Spending
While spending trends in 2024 seem to indicate a stabilization, the US furniture market reflects shifting consumer spending habits. The data suggests that online spending is maintaining momentum. Premium brands seem to benefit from strong customer loyalty, although market share expansion remains to be seen. Yodlee data suggests that performance across key metrics is mixed: transaction counts have grown for some brands, but AOV may have declined, possibly suggesting price sensitivity among consumers. These insights highlight the complexities of today’s evolving furniture market.
Want to see how transaction data can inform your investment process?
Learn more about Envestnet | Yodlee Merchant and Retail Insights and get a free demo from a sales representative.
About Envestnet | Yodlee Merchant, Retail, Shopper, and Spend Insights
Envestnet | Yodlee Merchant, Retail, Shopper, and Spend Insights utilize de-identified transaction data from a diverse and dynamic set of data from millions of accounts to identify patterns and context to inform spending and income trends. The trends reflect analysis and insights from the Envestnet | Yodlee data analysis team. By combining data with intelligence – connecting vast amounts of actual de-identified shopping data with state-of-the-art analytics and machine learning – Envestnet | Yodlee provides visibility into a large set of shopping daily purchase behavior including, but not limited to, transactions, customer lifetime values, and merchant/retailer shares.


