For the first time in seven years, Costco (US COST) has raised its membership fees, bumping Gold Star and Business memberships from $60 to $65 and Executive memberships from $120 to $130 as of September 1, 2024. Meanwhile, Walmart (US WMT), one of the largest U.S. retailers, has been making strategic moves to attract higher-income shoppers, many of whom are looking to trade down on everyday essentials.
How have consumers responded to these shifts, and which retail giant appears to be better positioned for the future?
Affluent shoppers can drive significant spending trends, making them a key demographic for investors to watch. To analyze these trends, we examined transaction data from Costco and Walmart to uncover early indicators of consumer response. Our analysis explores spending patterns, customer retention, cross-shopping behaviors, and the impact of Costco’s membership fee hike.
Costco’s Growth vs. Walmart’s Scale: How Do They Compare?
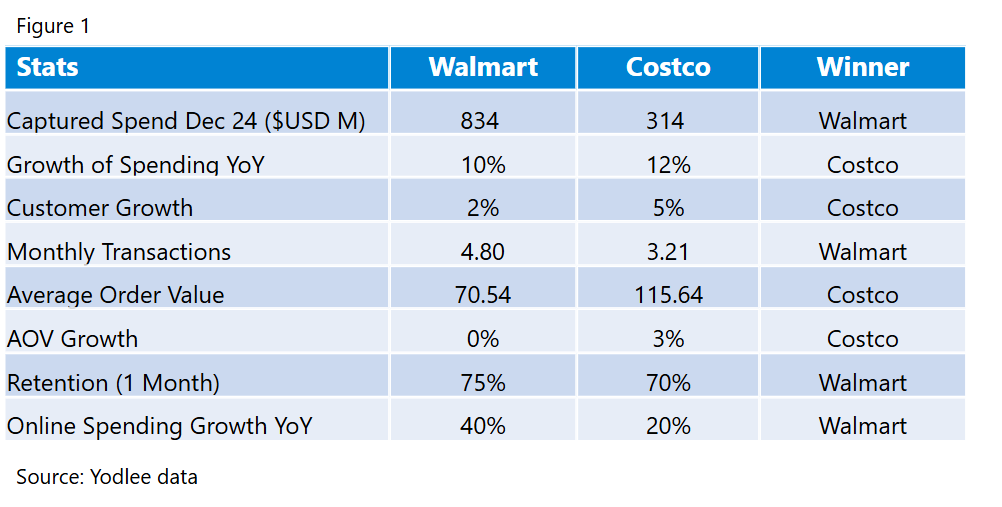
According to Yodlee’s data, Walmart leads in total spending, but Costco is gaining ground, with shoppers consistently spending more per visit.
Both retailers had a strong holiday season in 2024, with December spending rising 12% at Costco and 10% at Walmart (see Figure 1). But beyond seasonal trends, how are these two giants stacking up as they adapt to shifting consumer behavior? Let’s dive into the data to uncover key insights.
Shoppers Shrug off Costco’s Membership Fees Increase
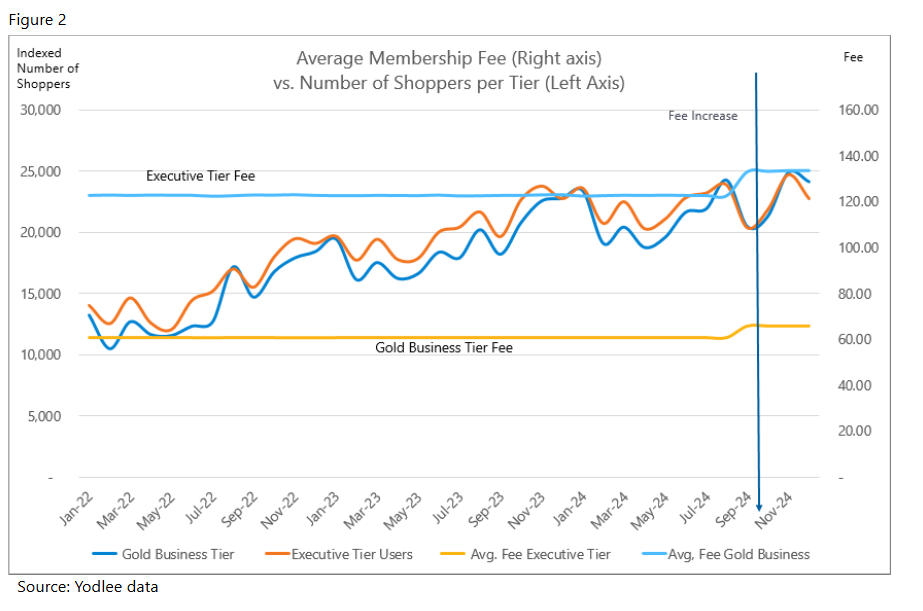
To measure the impact of Costco’s September 1, 2024, membership fee increase, we analyzed de-identified transaction data for its Gold and Executive tiers. A decline in membership fee transactions would suggest that fewer shoppers were renewing at the higher price.
While both tiers saw a dip in renewals in September 2024, the decline was short-lived. Membership transactions rebounded quickly, reaching record highs soon after. In fact, both tiers experienced year-over-year (YoY) growth in membership renewals not just in September but through the end of 2024 (see Figure 2). The data suggests that Costco’s loyal customer base remained largely unfazed by the price increase, reinforcing the strength of its membership-driven model.
Walmart’s Strategy Pays Off as High-Income Shoppers Boost Spending
Walmart, long associated with budget-conscious shoppers, has been actively courting higher-income households—and the effort appears to be working.
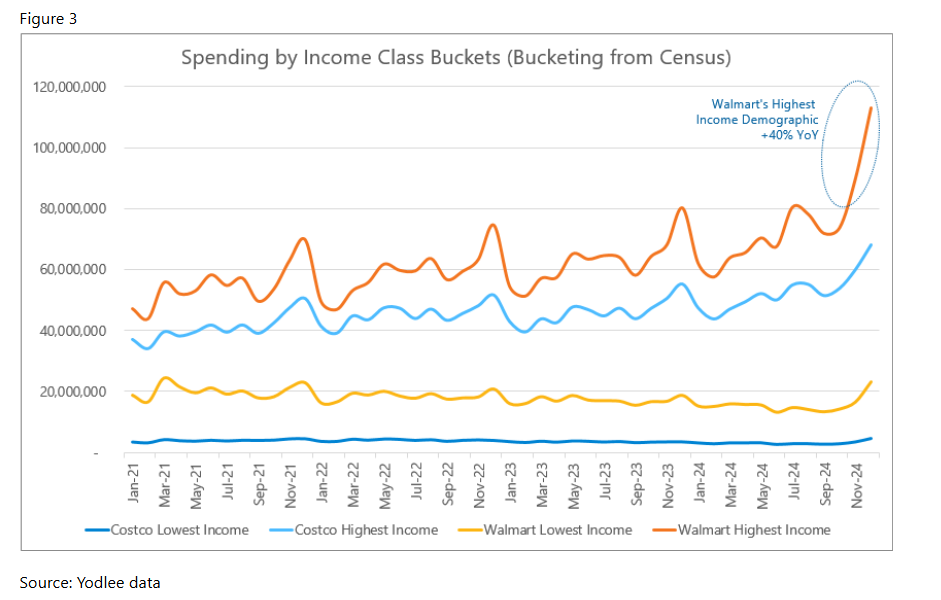
Yodlee data reveals that Walmart’s wealthiest shoppers (those earning $100,000 or more annually) significantly increased their spending in December 2024, surging 40% year-over-year (YoY)—the largest jump across any income group (see Figure 3).
While Walmart has publicly stated that this affluent segment drove 75% of its December market growth, our data suggests the figure is even higher at 78%, indicating a possible underestimation. Meanwhile, spending among Walmart’s lowest-income shoppers—who had seen a prolonged, multi-year decline—also rebounded in December (see Figure 3).
Both Costco and Walmart saw increased spending from their wealthiest customers, but Walmart’s growth was more balanced across all income levels. This broad-based appeal makes Walmart an increasingly attractive option for investors tracking consumer spending shifts across demographics.
Costco vs. Walmart: Who Wins on Spending, Loyalty, and Shopping Habits?
Both Costco and Walmart continue to expand, with strong spending growth, increasing shopper counts, and rising average transaction values. However, their strategies—and shopper behaviors—paint two distinct pictures.
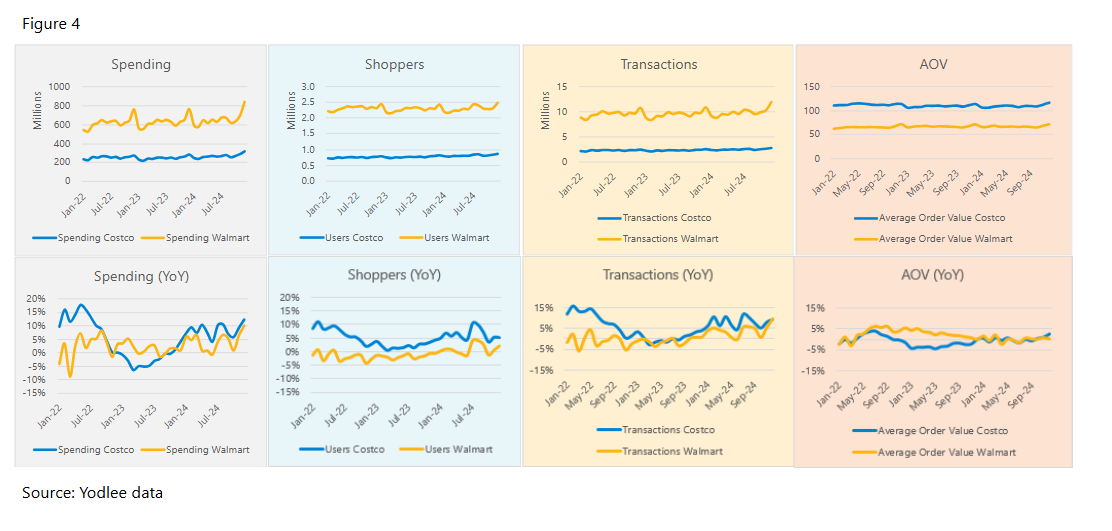
Yodlee data shows Walmart maintains a broader customer base with deeper market penetration, but Costco is growing its shopper counts at a faster rate. Despite raising its membership fees, Costco saw a 5% year-over-year (YoY) increase in shopper counts, compared to Walmart’s 2% growth (see Figure 4). Additionally, Costco shoppers tend to spend more per trip, with an average transaction value of $115 vs. Walmart’s $70 as of December 2024.
This aligns with Costco’s bulk-buying model, where fewer trips often translate to larger purchases. In contrast, Walmart has driven higher shopping frequency, with the average customer making nearly five monthly transactions, while Costco shoppers remain steady at around three.
Both brands are proving their strengths—Costco with high-value transactions and growing loyalty, and Walmart with frequent engagement and broad market appeal.
Customer Loyalty: A Tight Race, but Walmart Takes an Early Lead
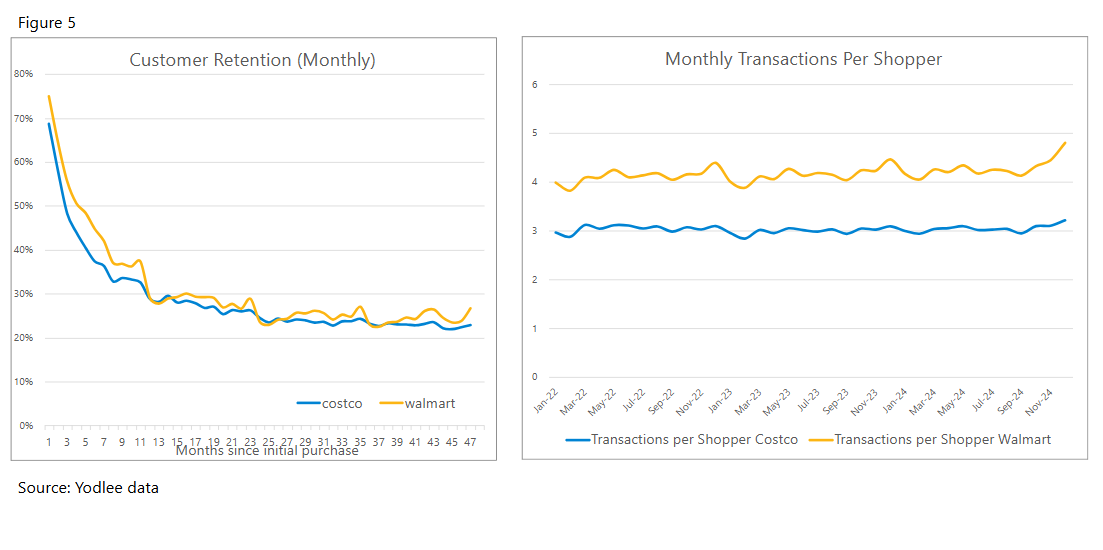
Both Costco and Walmart enjoy strong customer retention, with shoppers consistently returning to each retailer. However, our data suggests that Walmart holds a slight edge in the early months after a customer’s initial purchase (see Figure 5).
Walmart Surges in E-Commerce While Costco Lags Behind
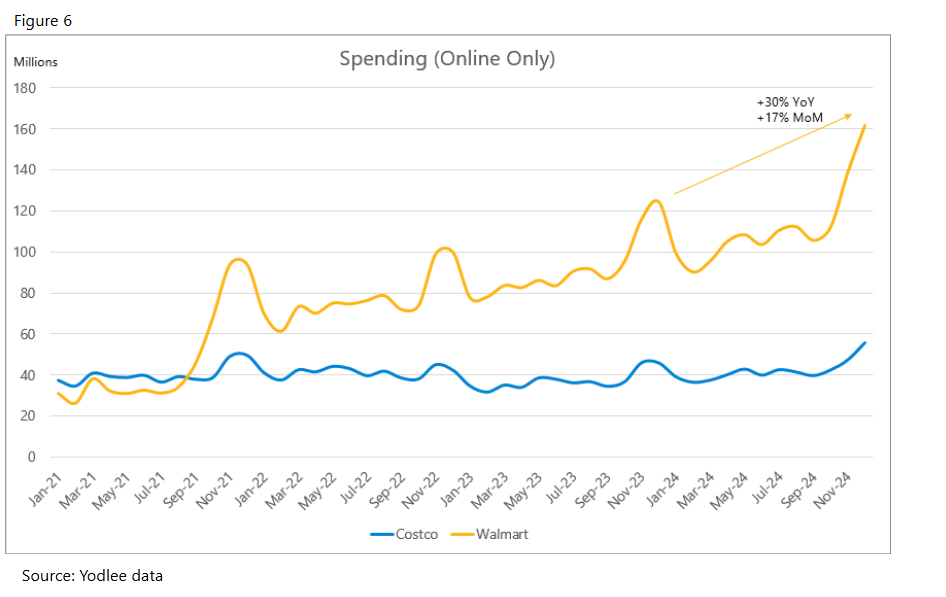
Walmart’s strong online strategy has been a key driver of its recent growth, particularly in grocery e-commerce. Over the past several months, Walmart’s online spending has surged—up 30% year-over-year and 17% month-over-month (MoM) (see Figure 6). In contrast, Costco’s online growth has been far more modest. While Costco offers in-store pickup and delivery options, its digital shopping experience hasn't seen the same level of expansion as Walmart’s. As online convenience continues to shape consumer behavior, Walmart’s e-commerce strength gives it a clear edge in capturing digital-first shoppers.
Two Retail Giants, Two Distinct Strategies
Costco and Walmart continue to thrive by leaning into their respective strengths—Walmart with its broad market reach and digital convenience and Costco with its high-spending, membership-driven model.
Walmart’s ability to attract high-income shoppers and expand its e-commerce presence positions it for continued growth. Meanwhile, Costco’s steady increase in shopper counts and strong per-transaction spending reinforce the resilience of its wholesale strategy.
For investors and market analysts, tracking transaction data provides key insights into how these retail giants are evolving and competing. As consumer behaviors shift, the ability to assess spending trends, loyalty patterns, and online engagement will be crucial in understanding which brand is best positioned for future success.
Want to see how transaction data can inform your investment process?
Learn more about Yodlee Merchant and Retail Insights and get a free demo from a sales representative.
About Yodlee Merchant, Retail, Shopper, and Spend Insights
Yodlee Merchant, Retail, Shopper, and Spend Insights utilize de-identified transaction data from a diverse and dynamic set of data from millions of accounts to identify patterns and context to inform spending and income trends. The trends reflect analysis and insights from the Yodlee data analysis team. By combining data with intelligence – connecting vast amounts of actual de-identified shopping data with state-of-the-art analytics and machine learning – Yodlee provides visibility into a large set of shopping daily purchase behavior including, but not limited to, transactions, customer lifetime values, and merchant/retailer shares.