In this analysis of the U.S. gasoline market, we explore how consumer spending on fuel appears to have shifted in response to price dynamics between the years 2021 and 2024 as customers got back on the road post the lockdown. Using Envestnet® l Yodlee®’s de-identified transaction data, we examine spending patterns, transaction frequency, and income-based behavior changes that reveal how Americans are adapting their fueling habits amid elevated costs.
From holiday-driven demand surges to regional pricing differences, Yodlee data analytics uncover the forces shaping consumer spending at the pump, offering insights into how spending choices in this area may impact other budget priorities.
Tracking the Ups and Downs of Gasoline Prices
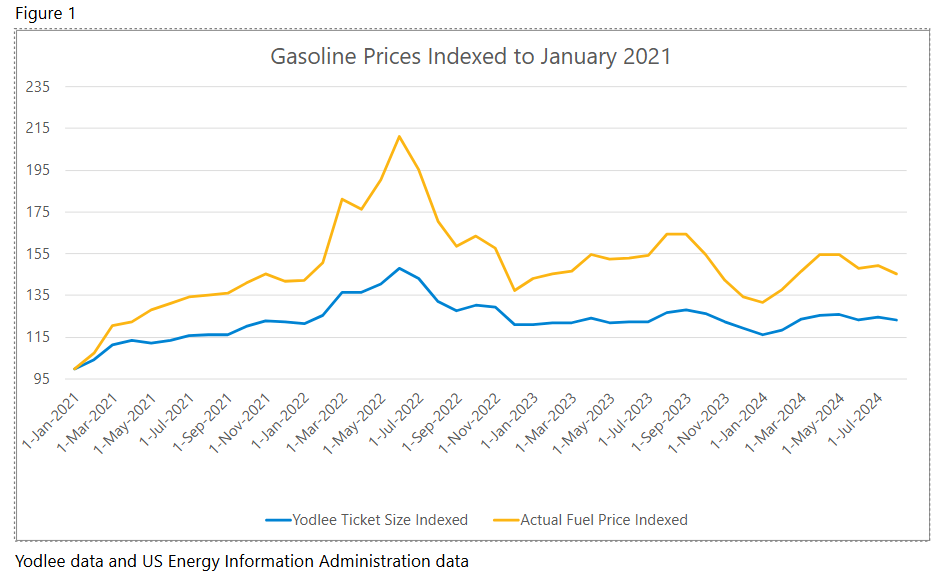
As shown in the chart above, gasoline prices have gone up and down over the last three and a half years. Yodlee data analytics illustrate steady spend increases during the post-pandemic recovery in 2021 followed by a significant run up in the first half of 2022. In July 2022, gasoline prices began to moderate yet continued to fluctuate throughout 2023 and the first half of 2024. Note the Yodlee indexed data spend largely mirrored the actual fuel price indexed data, from the U.S. Energy Information Administration, for the period June 2021 to July 2024 (Figure 1).
A Pew Research Center article from August 2024, “Eggs, gasoline and car insurance: Where inflation has hit Americans hardest” reinforces that from January 2020 to June 2022, gas prices nearly doubled, but since then, they’ve fallen.
Spending Frequency and the Ticket Size Shifts
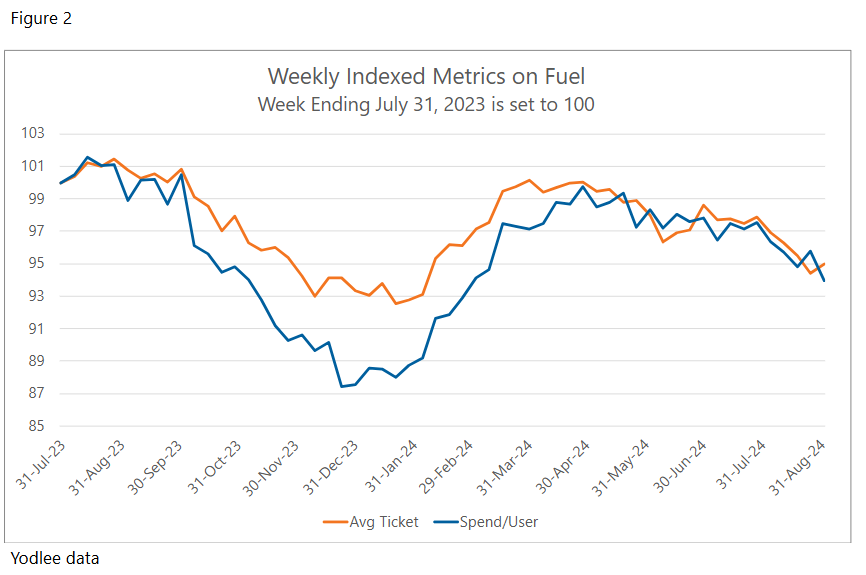
Looking at a graph of Yodlee’s data for weekly average ticket size—or spend per transaction—and spend per user (Figure 2), the decline in spend per transaction in 2023 suggests that consumers reduced their spending per visit on a weekly basis. However, a recovery in both metrics in April 2024 suggests that consumers increased both their transaction frequency and spending more per visit.
This is consistent with an NACS article noting that rising prices, the pandemic, supply chain disruptions, and labor shortages shaped consumer mood and fueling habits.
Seasonal Patterns: Looking at the Memorial Day Surge
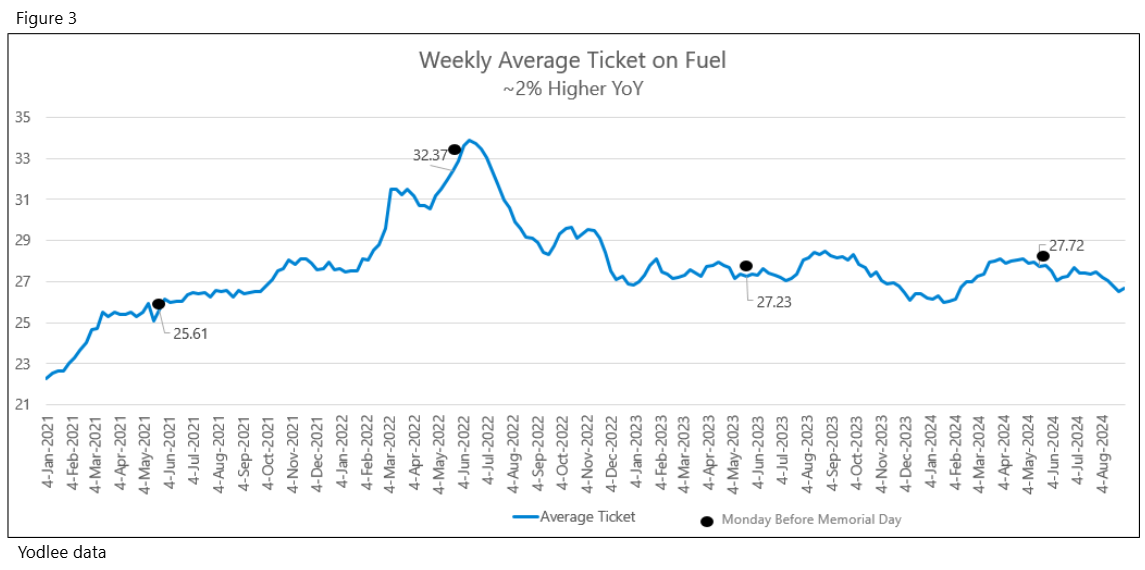
Memorial Day weekend has long marked the beginning of America’s summer driving season. Yodlee data for the 2024 Memorial Day weekend reveals a ~2% increase in average ticket sizes over the previous year, highlighting the sustained impact of seasonal travel. (Figure 3.)
State-Level Price Variability: Geography Matters
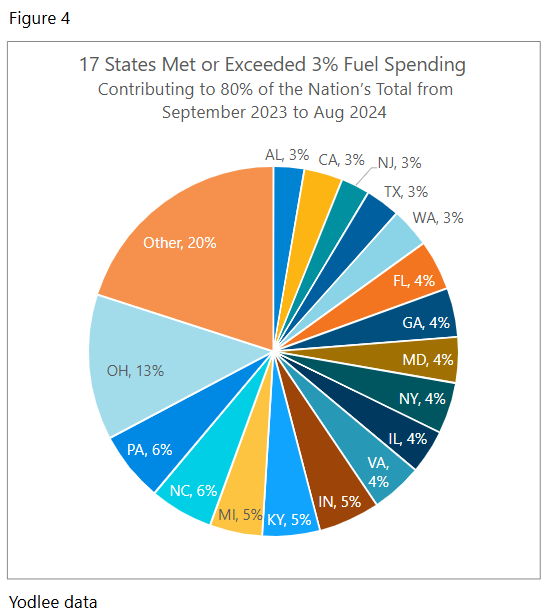
Not all U.S. states experience gasoline prices equally. Seventeen states met or exceeded 3% each in fuel spending and accounted for 80% of total national spending over the last 12 months (Figure 4).
Interestingly, drivers in affordable states like Indiana spend more on gas, at 5%, on average than their peers in California, at 3%. This is thanks to longer commutes and more time spent on the road, as seen in Bankrate’s Hidden Costs of Car Ownership Study.
Regional Spending Patterns: Weekly Insights from the Pump
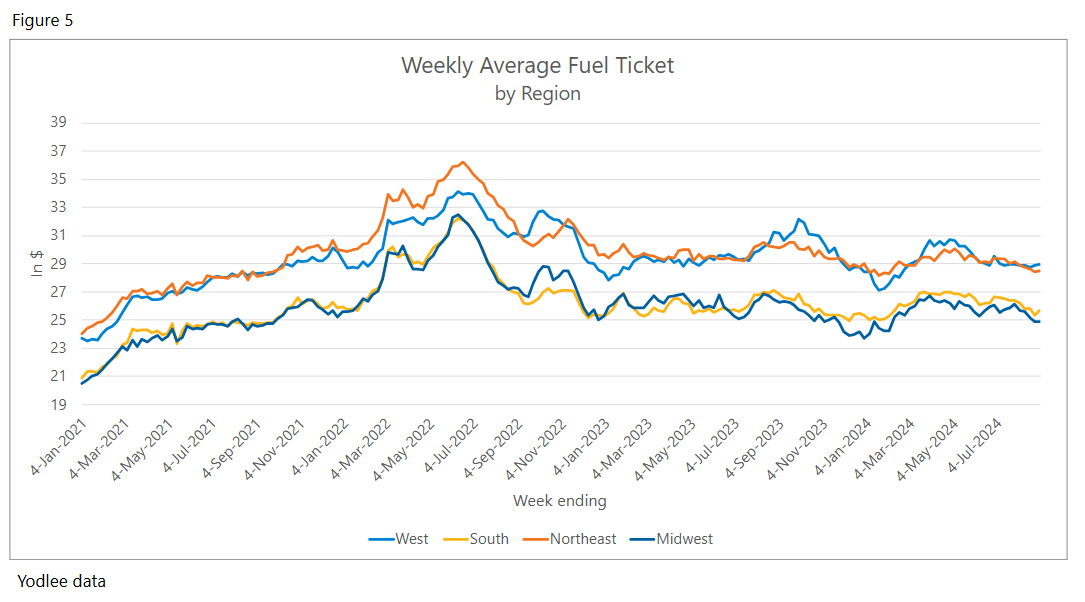
From January 2021 to August 2024, weekly average gasoline prices in the Northeast and West regions consistently trended above those in the Midwest and South (Figure 5). This regional price disparity held steady until prices spiked in 2022, at which time prices across all regions appeared to briefly converge, temporarily narrowing the gap, before returning to prior patterns.
Income-Level Disparities: Gasoline Affordability Divides
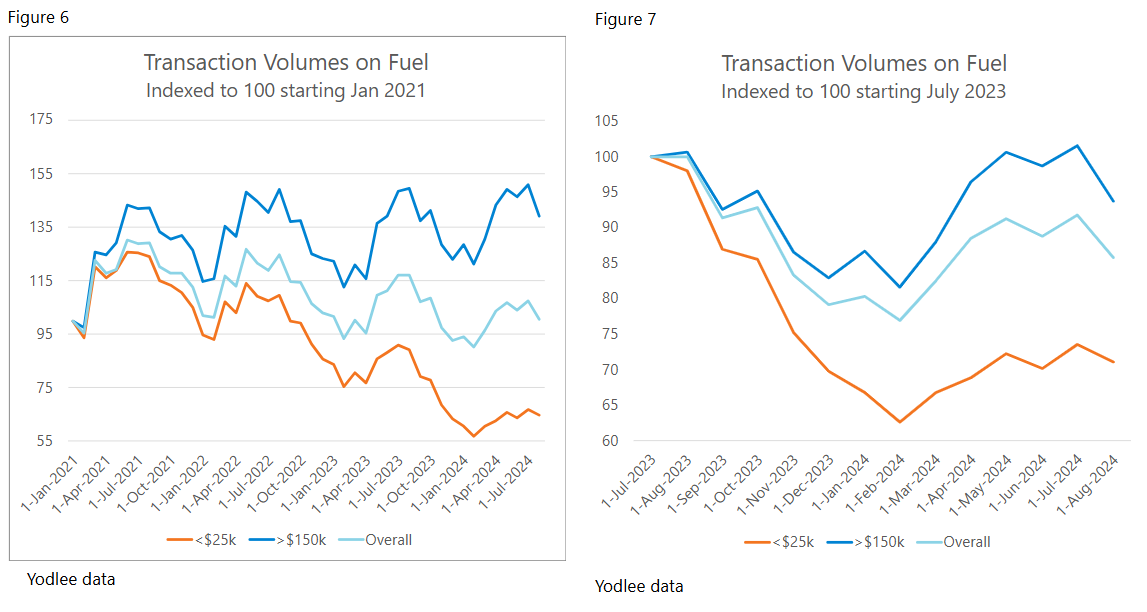
Yodlee data reveals that lower-income consumers have notably reduced their gasoline purchases since 2021, reflecting a sensitivity to price increases that higher-income groups appear less affected by. Lower-income households have responded by cutting back on both transaction frequency and volume, adjusting their travel habits in response to gasoline’s rising share of household budgets (Figure 6). According to ACEEE, low-income households spend nearly 20% of income on home energy and auto fuel costs combined.
While transaction volumes for all consumer groups have declined YOY, gasoline spending for higher-income consumers suggests a resilience to price pressures. This economic divide in gasoline affordability highlights how fuel costs disproportionately impact lower-income groups, potentially reshaping consumer behaviors over the long term as these groups adapt their transportation choices amid sustained price increases (Figure 7).
Fuel Costs and Consumer Choices
Yodlee’s data analytics paint a detailed picture of gasoline spending in the in the face of fluctuating fuel prices. From holiday weekend spikes to income-level disparities, the analysis reveals a consumer landscape that reflects broader economic pressures and regional dynamics.
As gasoline prices remain a major factor in consumer spending, understanding these nuanced patterns offers invaluable insight for investment managers and market researchers aiming to navigate the complexities of the U.S. fuel market. Continuing to monitor these trends with de-identified and multi-dimensional data sets and analytics can provide a window into the ongoing adjustments consumers make in response to the ever-changing cost of fuel.
Want to get ahead of spending trends?
Subscribe to our research data blog for ongoing updates or reach out for a personalized, up-to-date view of Yodlee transaction data.
About Envestnet | Yodlee Merchant, Retail, Shopper, and Spend Insights
Envestnet | Yodlee Merchant, Retail, Shopper, and Spend Insights utilize de-identified transaction data from a diverse and dynamic set of data from millions of accounts to identify patterns and context to inform spending and income trends. The trends reflect analysis and insights from the Envestnet | Yodlee data analysis team. By combining data with intelligence – connecting vast amounts of actual de-identified shopping data with state-of-the-art analytics and machine learning – Envestnet | Yodlee provides visibility into a large set of shopping daily purchase behavior including, but not limited to, transactions, customer lifetime values, and merchant/retailer shares.
To learn more about Envestnet | Yodlee Merchant and Retail Insights and get a free demo, please contact an Envestnet | Yodlee sales representative.


