Typically, concerns over an economic slowdown may lead investors to look for warning signs of slowing consumer consumption. This can act as a leading indicator of an impending recession. Investors tend to focus on core aspects of consumption, especially in areas where inflation has been more of a burden. One such area where there may be a change in consumer behavior is restaurants, especially across three major categories:
- Quick-serve restaurants (QSR) include food chains of such companies as McDonald’s (MCD US), Wingstop (WING US), and Yum Brands (YUM, US), purveyors of chains like KFC, Taco Bell, and Pizza Hut
- Casual includes sit down restaurants such as The Cheesecake Factory (CAKE US), Bloomin’ Brands (BLMN US), Outback Steakhouse, and Darden International (DRI US), the holding company behind Olive Garden and others.
- Fast casual is typically characterized as companies such as Chipotle Mexican Grill (CMG US), Sweetgreen (SG US), and Cava (CAVA US) that do not offer full table service but advertise a higher end experience.
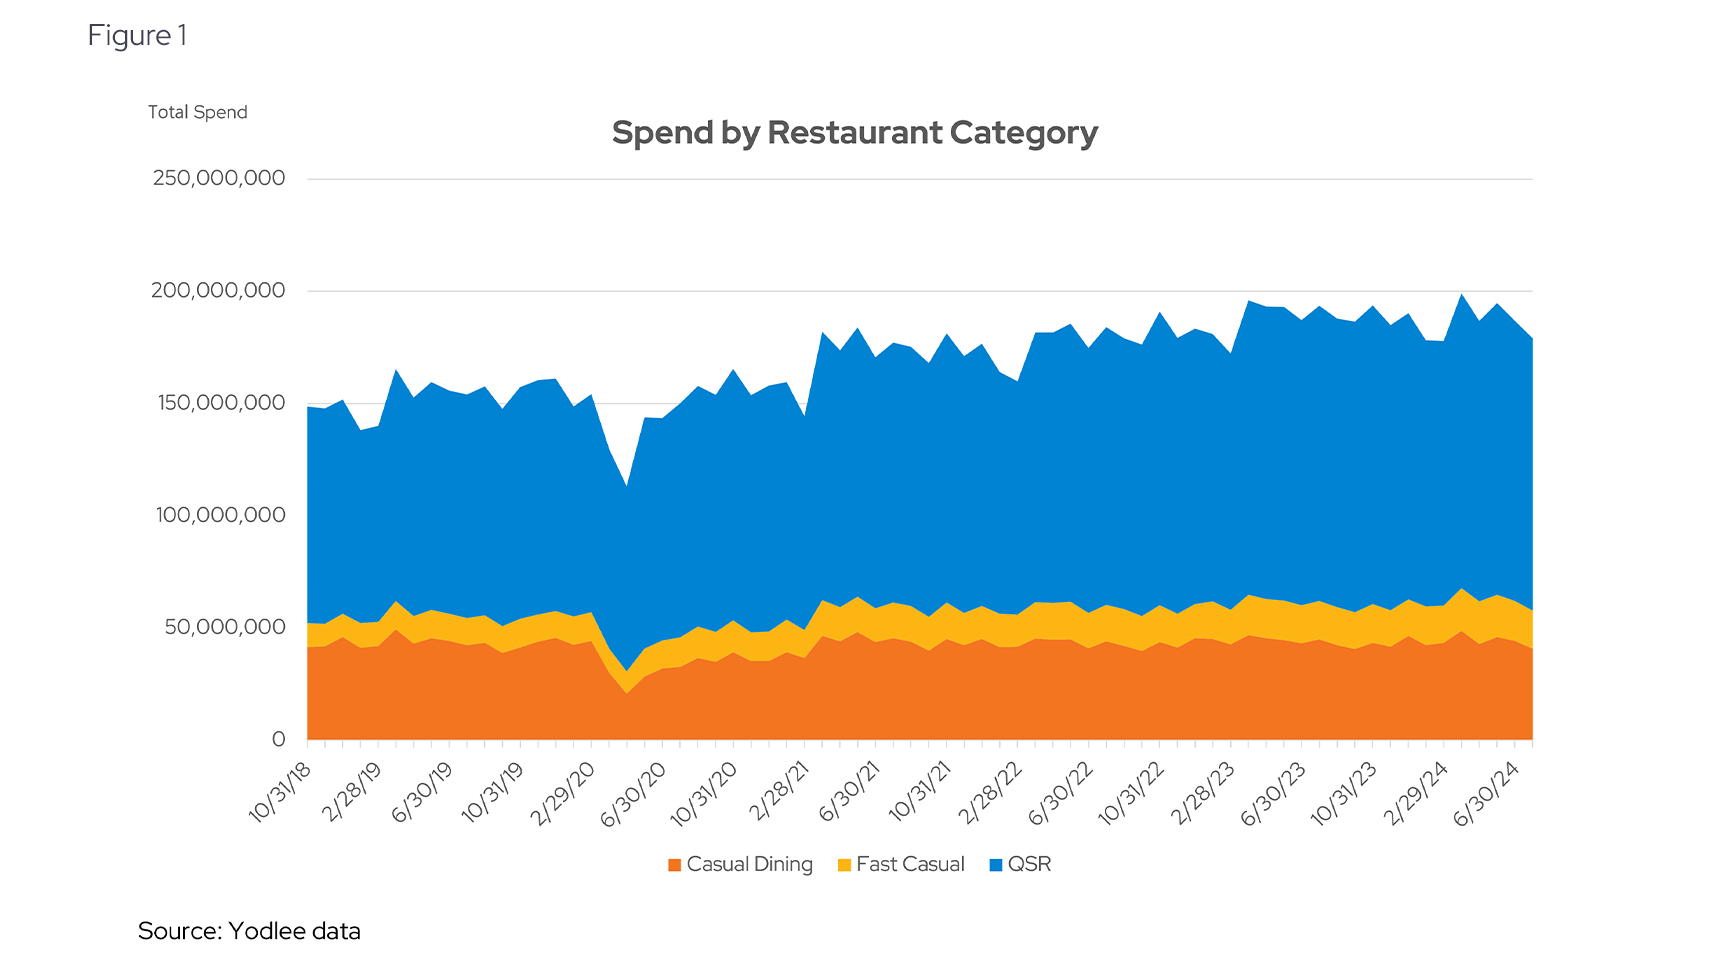
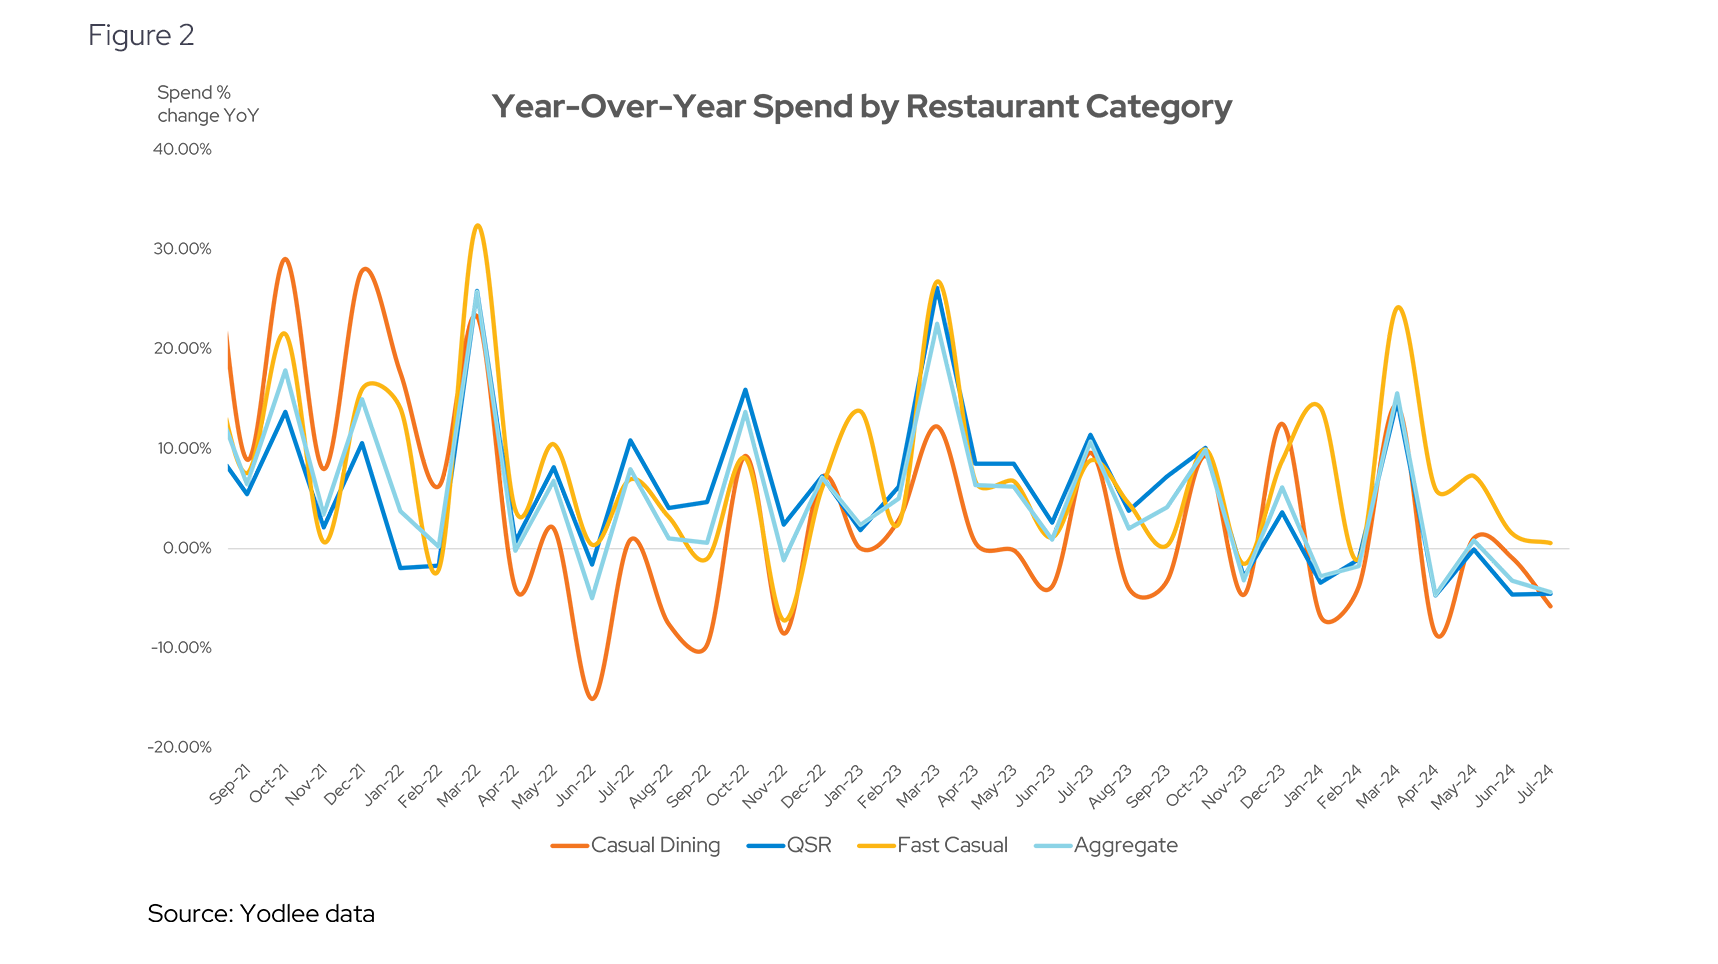
Utilizing Envestnet® | Yodlee®'s extensive collection of de-identified transaction data, we can provide insight into today’s consumer habits. Yodlee transaction data has recently been demonstrating a weakening of spend across 90 brands, aggregated across 27 holding companies, and the three restaurant categories we’ve defined. Looking at monthly spend across our panel, the data indicates a peak of transaction volume at the end of the first quarter of 2024, (Figure 1) with year-over-year growth decelerating (seasonally adjusted, see Figure 2).
This deceleration has followed a few years of what has been described as a price-taking strategy across many of these brands. To the extent the rise in prices have outpaced real wages, it can result in a pullback in spend, changing the consumption equation between dining out and eating at home. In this piece, we’ll bucket these 90 brands across our three categories and perform a deep dive into some of the most interesting trends we see across the data.
Deceleration Across Categories
In terms of year-over-year comps, deceleration has been more pronounced across the Fast Casual category, but perhaps more consequential across Casual and QSR. The latter is because Casual and QSR have moved into negative year-over-year growth. This softer growth will likely curb additional price increases in the restaurant space. As a result, if brands cannot re-engage traffic while holding or modestly reducing average transaction values, then there is a potential for additional revenue and margin pressure in 2025 (more on that later):
Across most brands, we see that decline in year-over-year transactions in the second quarter. There is a mixed story on average spend per transactions, as brands have different strategies regarding pricing. That strategy may depend on factors such as their growth cycle and their relative positioning.
To unpack this, if we plot the 2-year change in transaction volume and average spend across 27 holding companies (tagged by category), we can see a relationship between increases in price over the last two years and potential decline in transaction volume (Figure 3). That pairing (price increase / decline in transactions) would be represented by the bottom right quadrant in the scatter plot below, versus increases in prices with increases in average spend occurring in the top right quadrant.
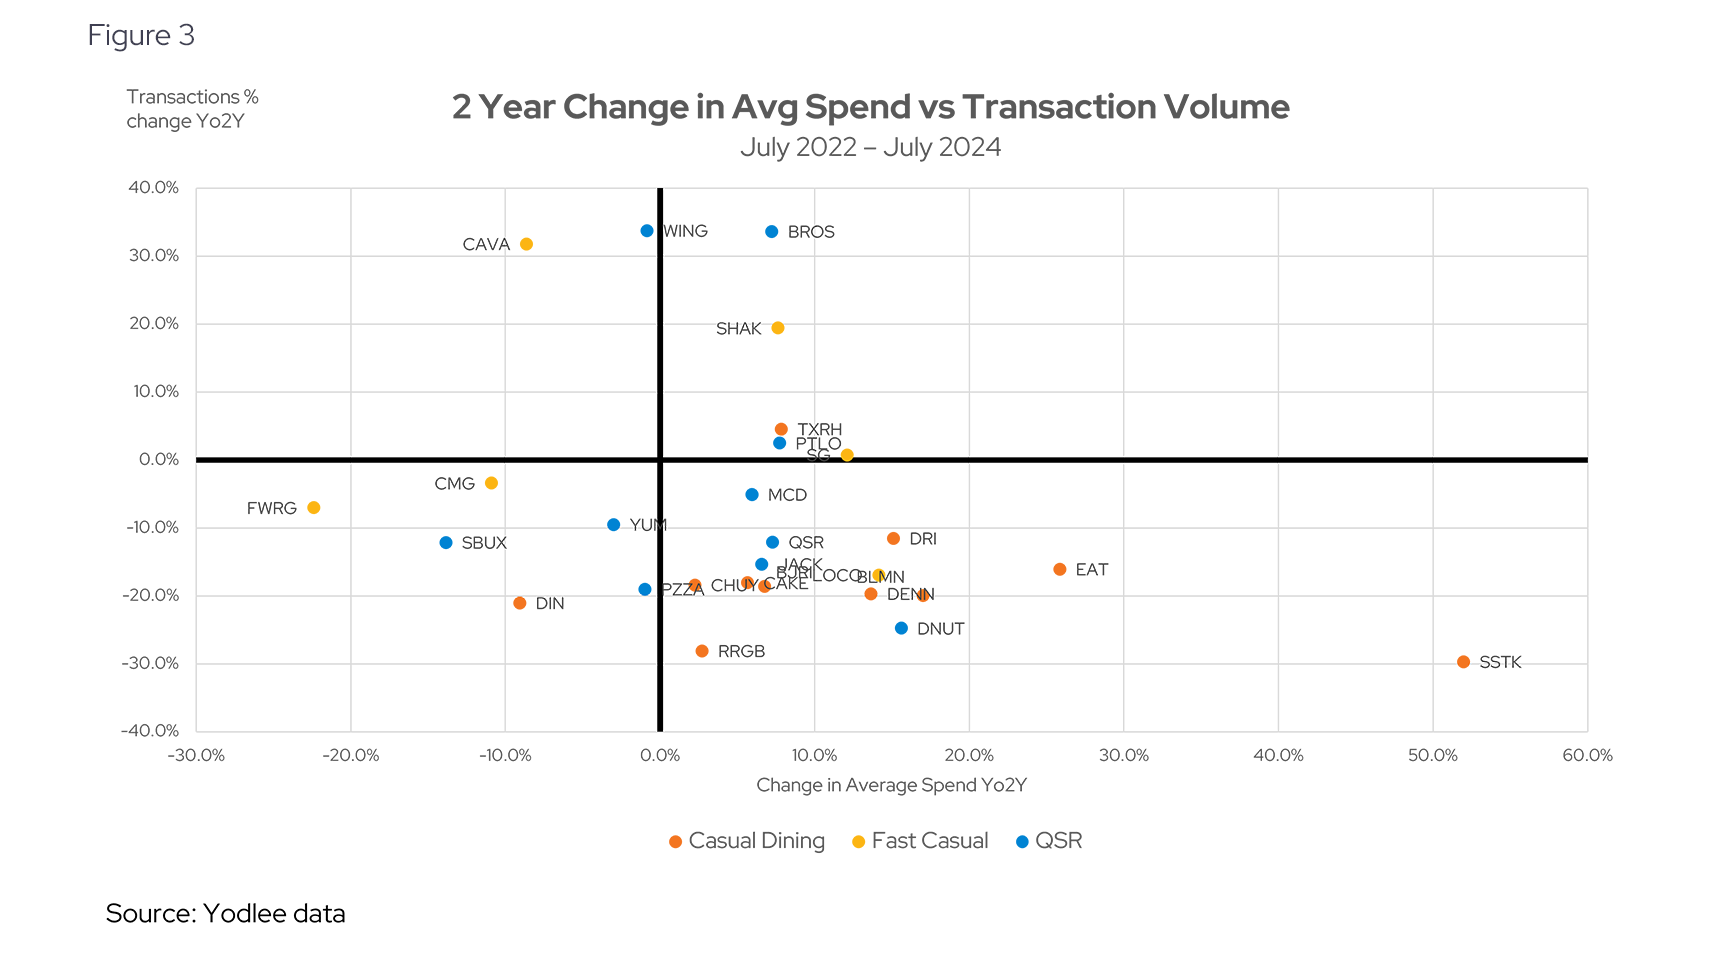
Grouped by category, we can clearly see that casual dining has experienced the broadest deceleration across both average spend and number of transactions, while fast casual has mostly benefited from an increase in average spend (with flat transaction change admittedly across a wide variance of individual brands). Admittedly, brands in the top right quadrant (increase in spend & increase in transactions) have benefited from expansion via store openings. For example, Dutch Bros (BROS US) increased its US store footprint by 25% in 2022 and 24% in 2023. This should be factored into an analysis of transaction volume, which aren’t adjusted for same-store-sales.
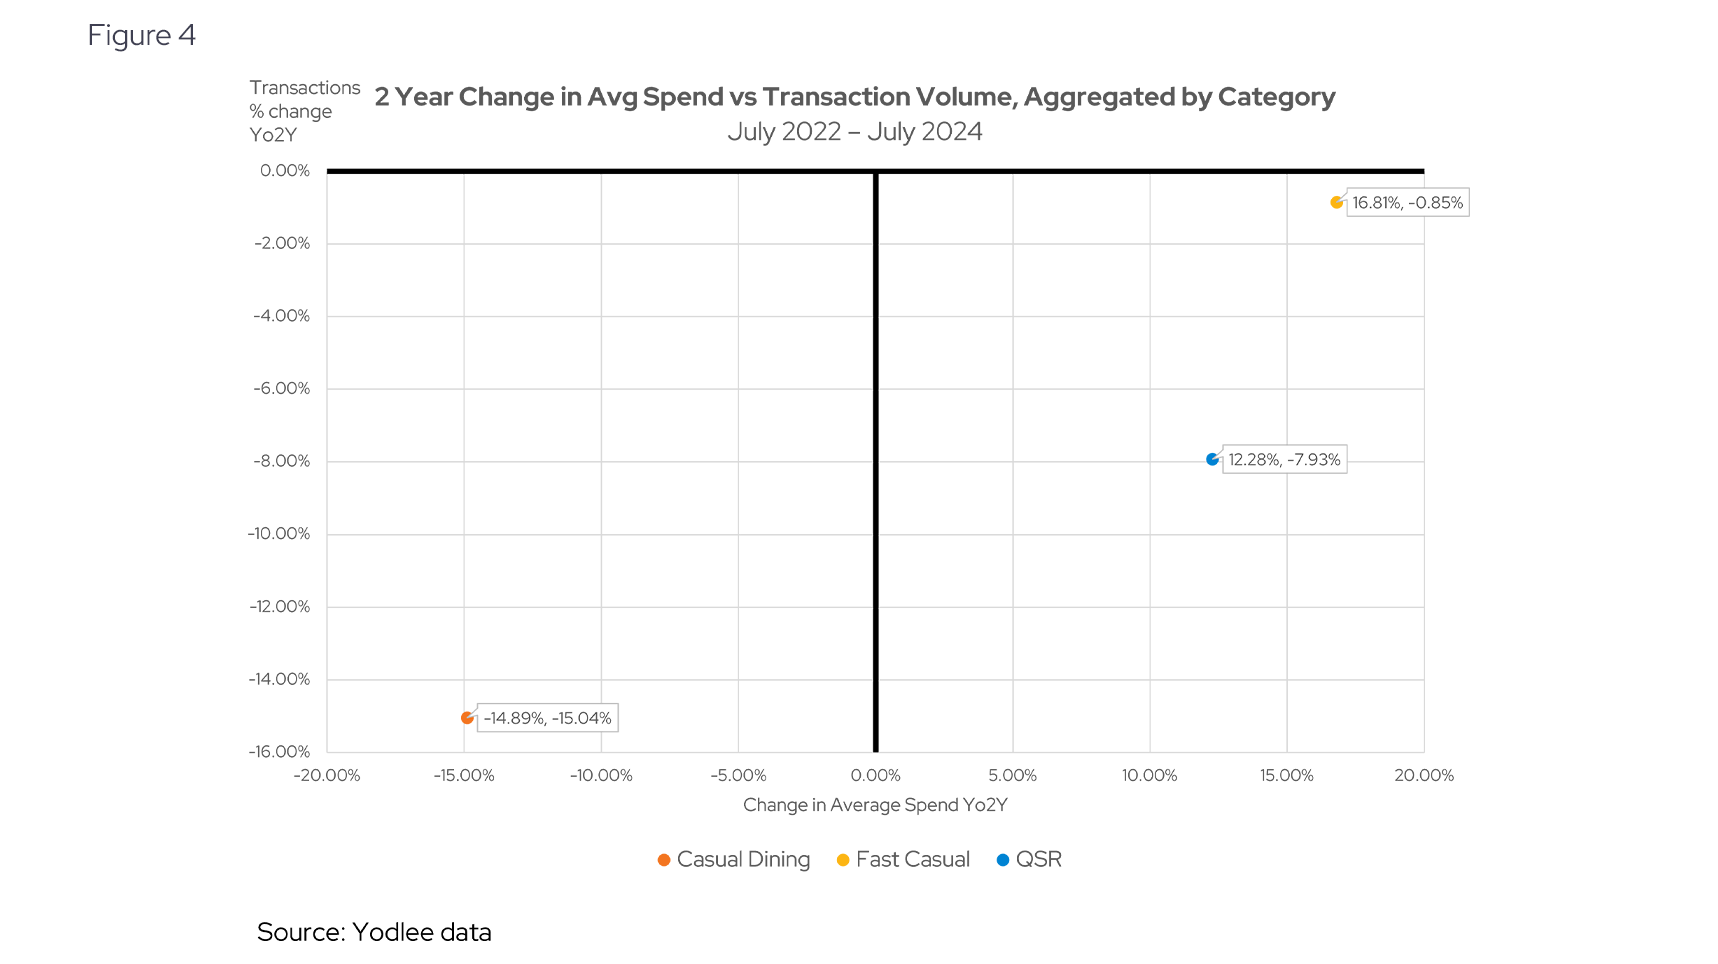
Nevertheless, QSR has seen the most divergent results, as it appears that spend is increasing and transactions are decreasing (Figure 4):
Moving beyond categories, we’re highlighting a few situations that are particularly interesting: McDonald’s (MCD US), the heavyweight in the QSR space, and the coffee vertical (a previously discussed topic), where an upstart has been challenging a titan undergoing significant change, and a cohort of new brands diverging from their legacy counterparts.
McDonald’s Adjusts to Price Sensitivity
McDonald’s is the largest QSR franchise in the country, with over 13,500 locations in the US as of March 2024. The company has also been one of the more aggressive price takers in the last few years. We see this across our data with the average transaction value increasing from ~$9 to a peak of nearly $13 in December 2023 (a 44% increase in average spend). The company may dispute this characterization as aggressive price taking, suggesting it is a pass-through cost of inflation. In the last 7 months however, that average transaction value has declined, to a bit above $12 (Figure 5):
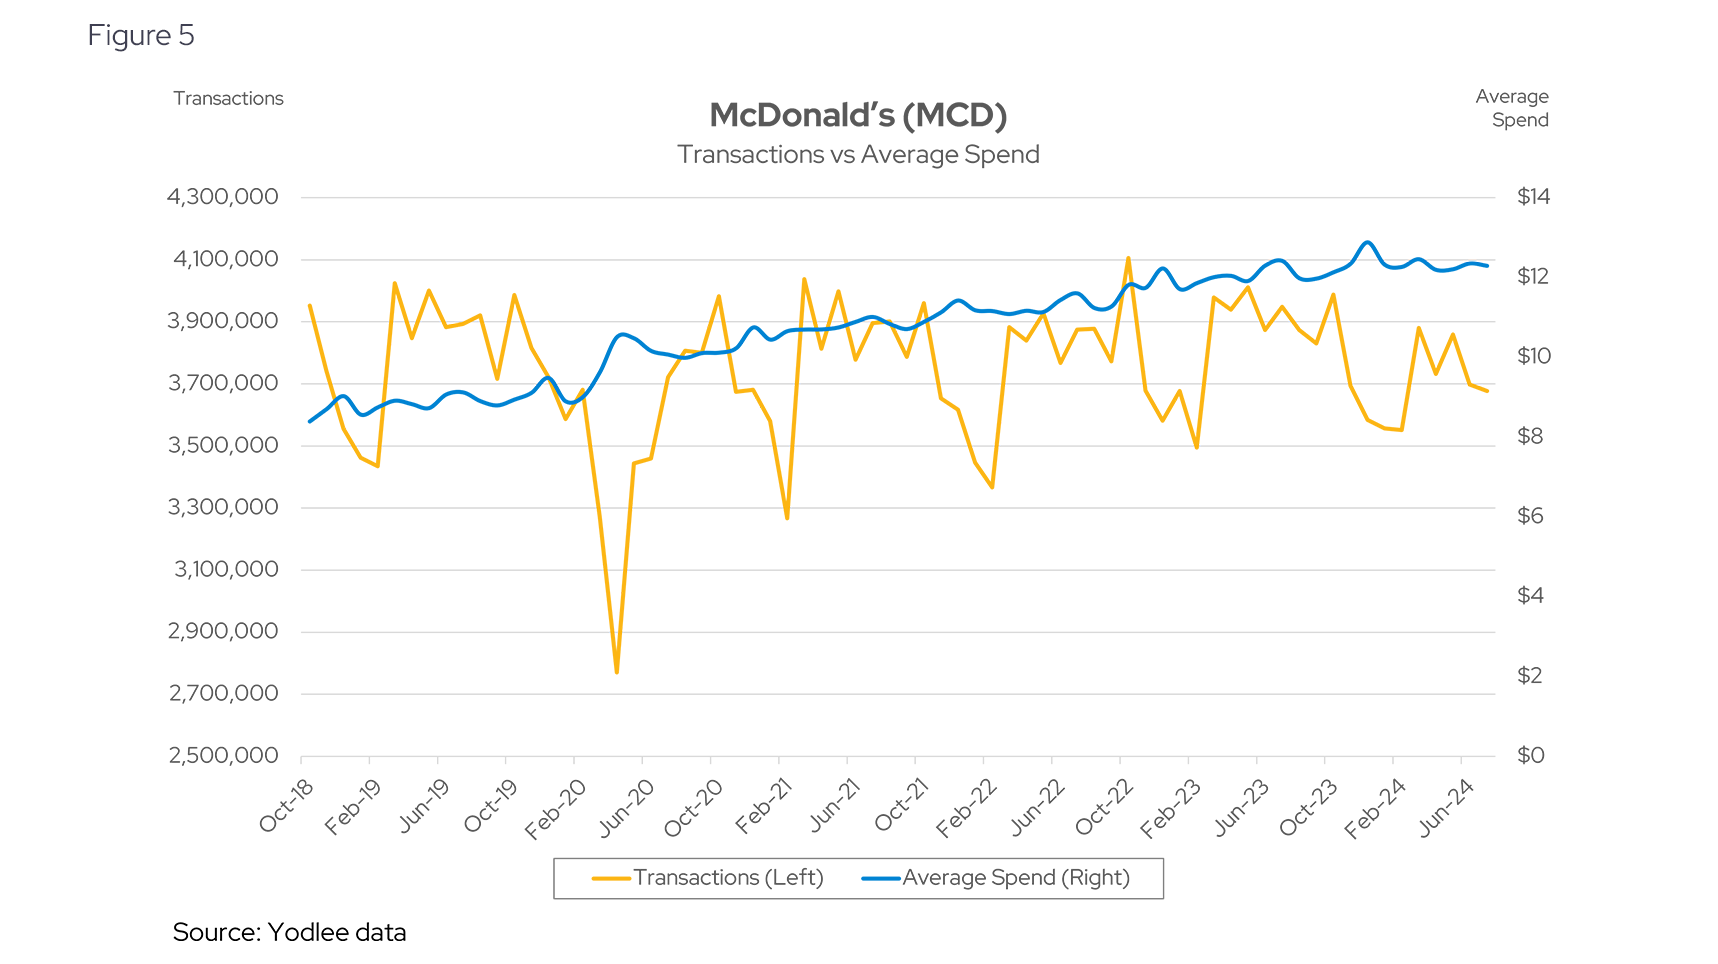
Adjusting for seasonality, this has led to a meaningful deceleration of growth. The company reported its first global drop in sales since the pandemic. During the company's 2nd quarter earnings call, it was highlighted that consumers are becoming more selective in their spending, with noticeable declines in transaction volumes and mix, reflecting low consumer sentiment across key markets. In June, the company introduced a limited time meal special for $5. This appears to demonstrate a re-orientation of pricing as the company adjusts to the consumer pullback in spend.
Coffee: A Growth Upstart vs The Consumer Pushing Back on a Favorite
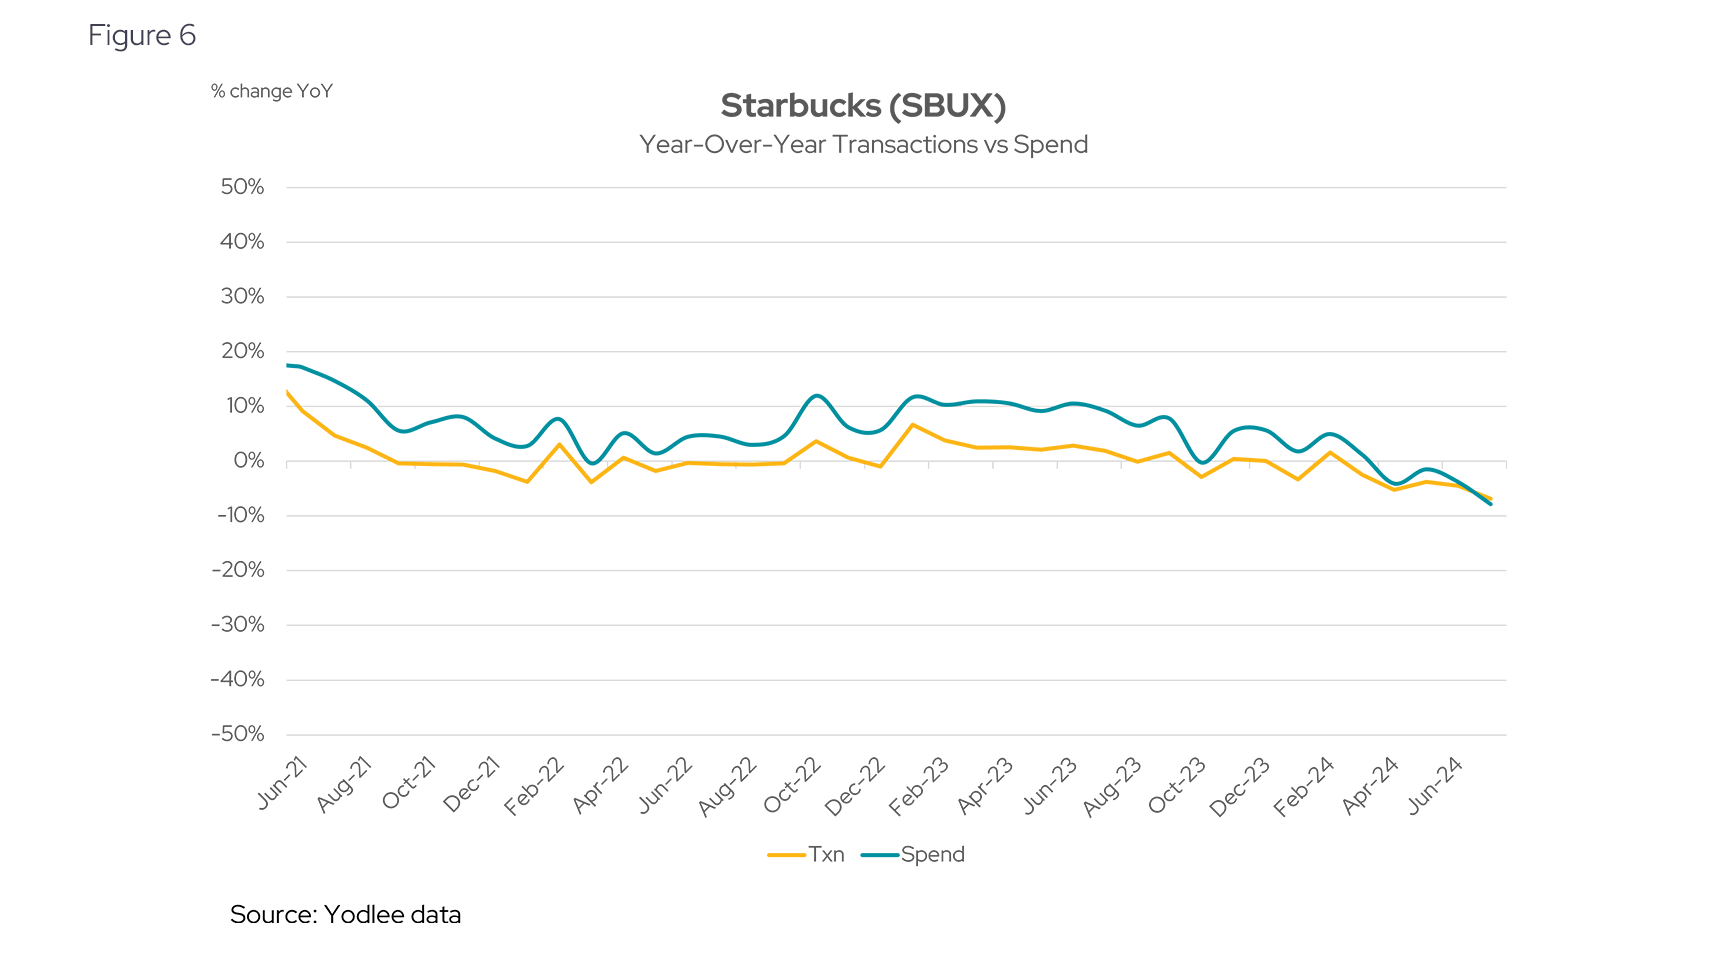
Coffee chains have also faced pressure, with Starbucks reporting a 3% year-over-year decline in same-store-sales, representing the 2nd quarter of sequential decline. It also cuts its full year guidance, the second time in six months (see Figure 6). The lowered guidance was coupled with Starbucks announcing that CEO Laxman Narasimhan will step down and be replaced by the current Chipotle Mexican Grill CEO Brian Niccol.
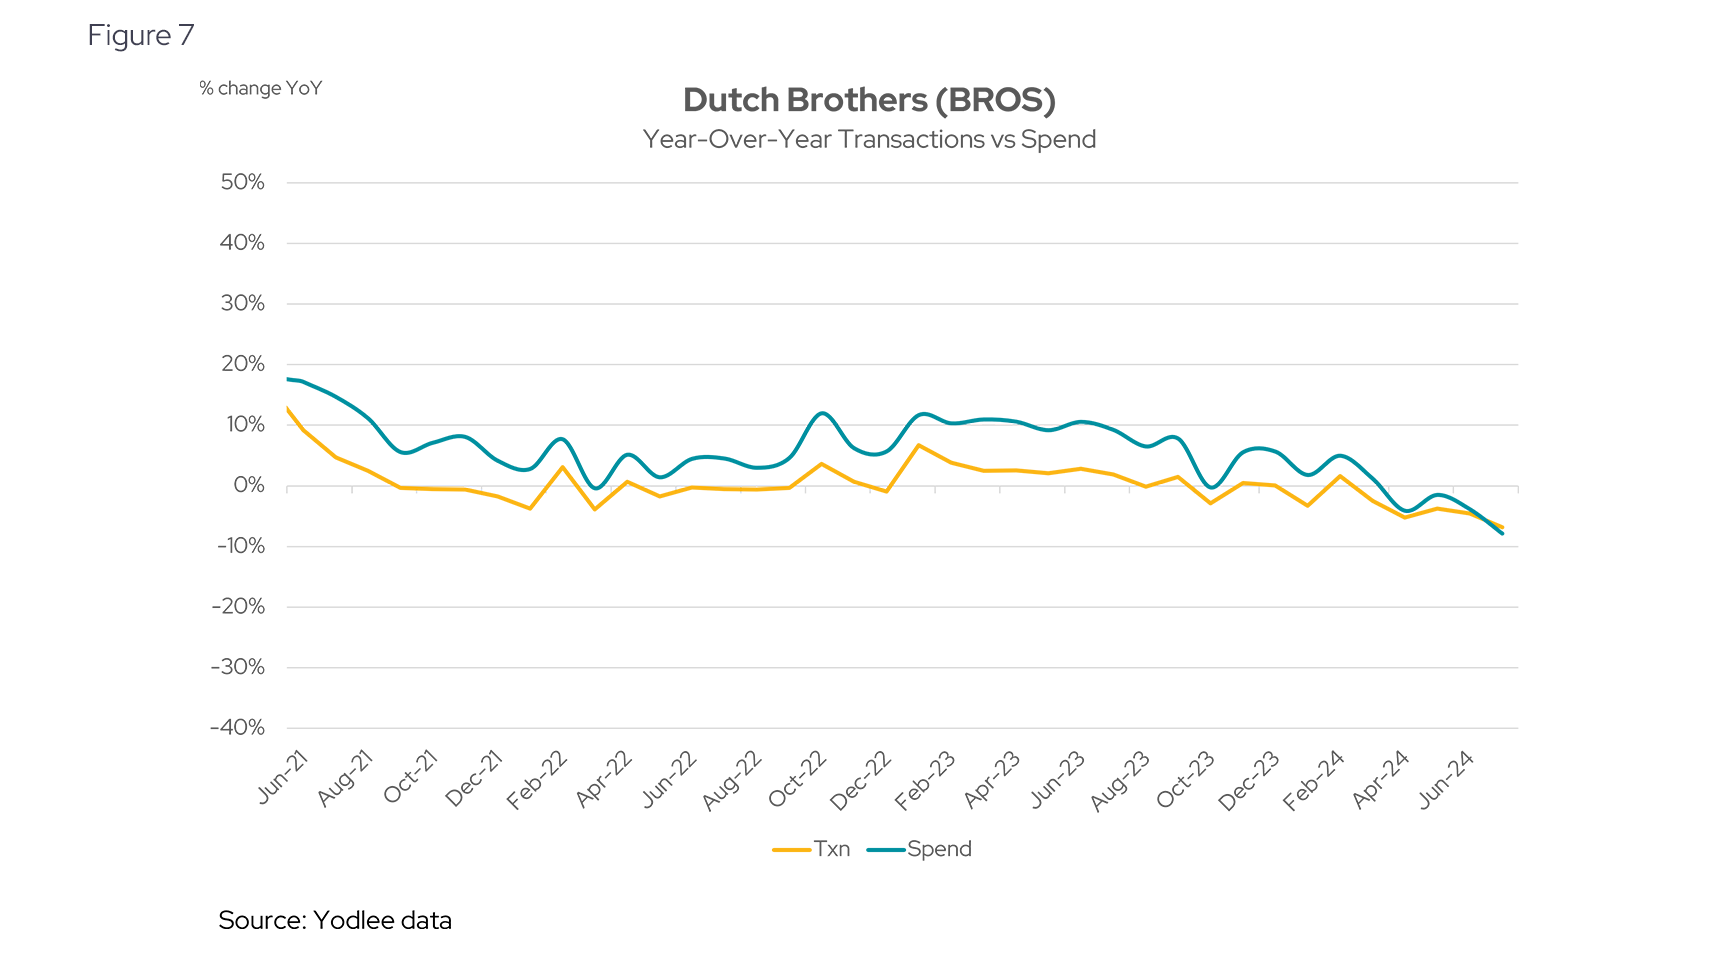
Compare this to Dutch Bros (BROS US), which has been a growth story we’ve previously referenced. Even with a slight deceleration since June, transactions and spend grew in the mid-teens in July 2024, driven in part by store expansion (see Figure 7):
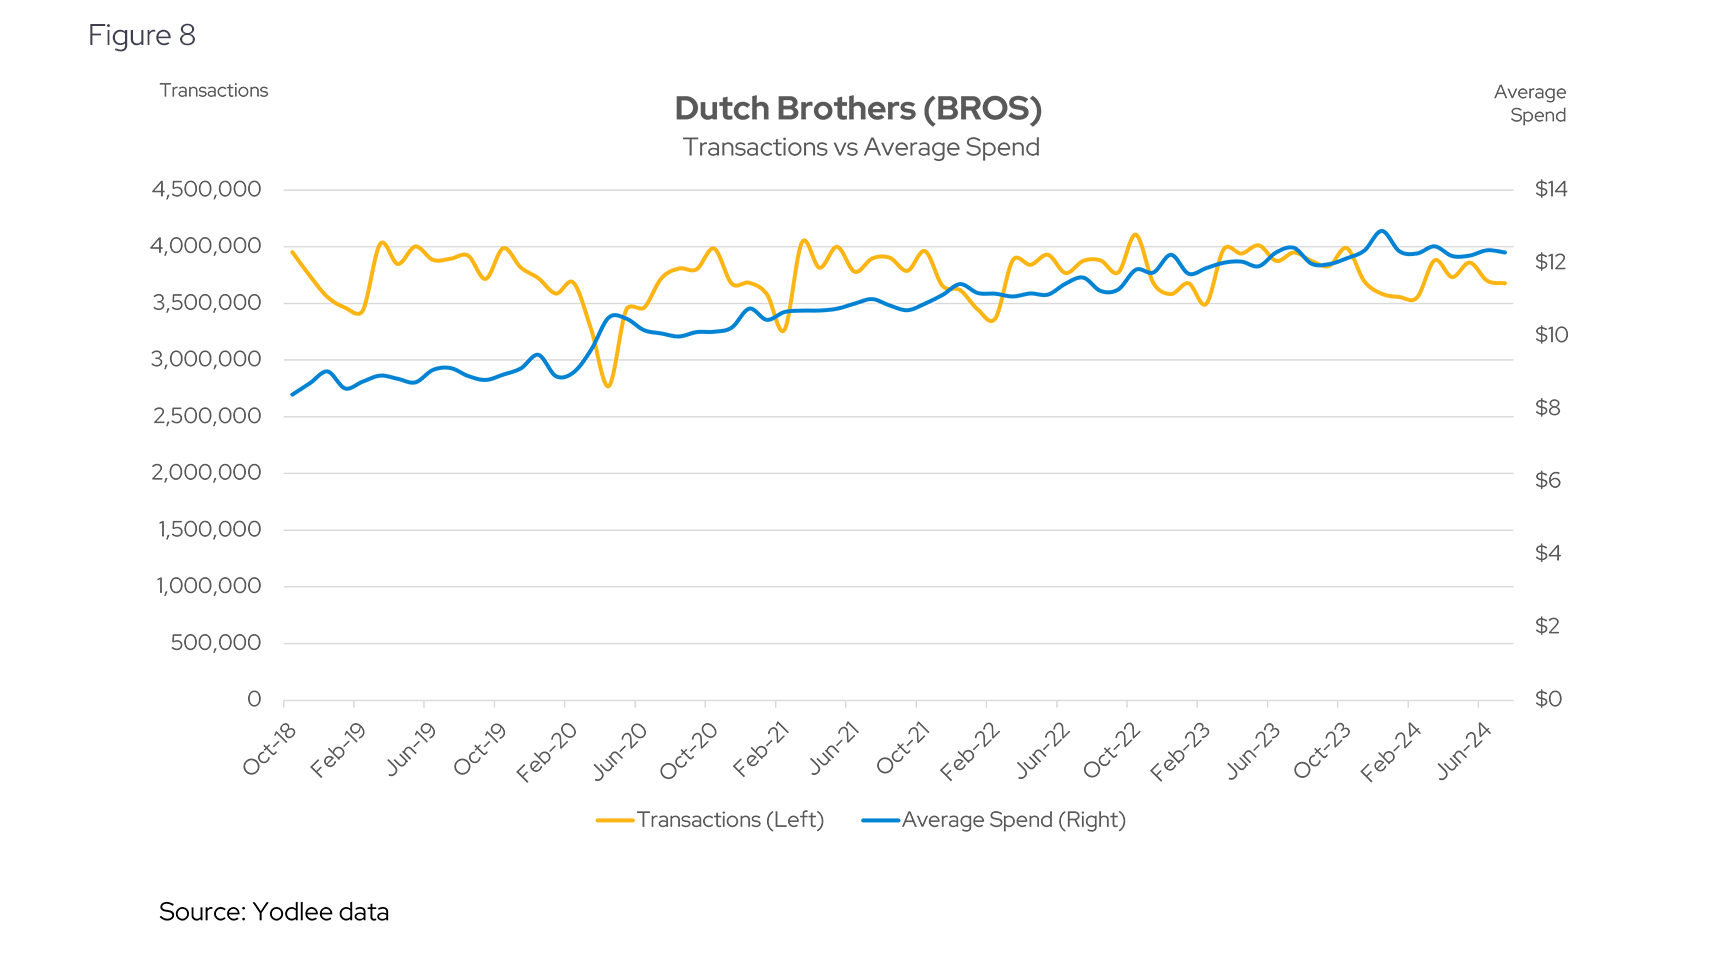
During their August 8th earnings call, Dutch Bros reported a 30% year-over-year revenue growth in Q2 and continued expansion with over 30 new shop openings. However, management expressed caution about potential challenges, noting rising concerns in the consumer market. That said, we haven’t witnessed a slowdown in average spend (Figure 8):
Do Consumers Prefer Fresh Takes to Traditional Brands?
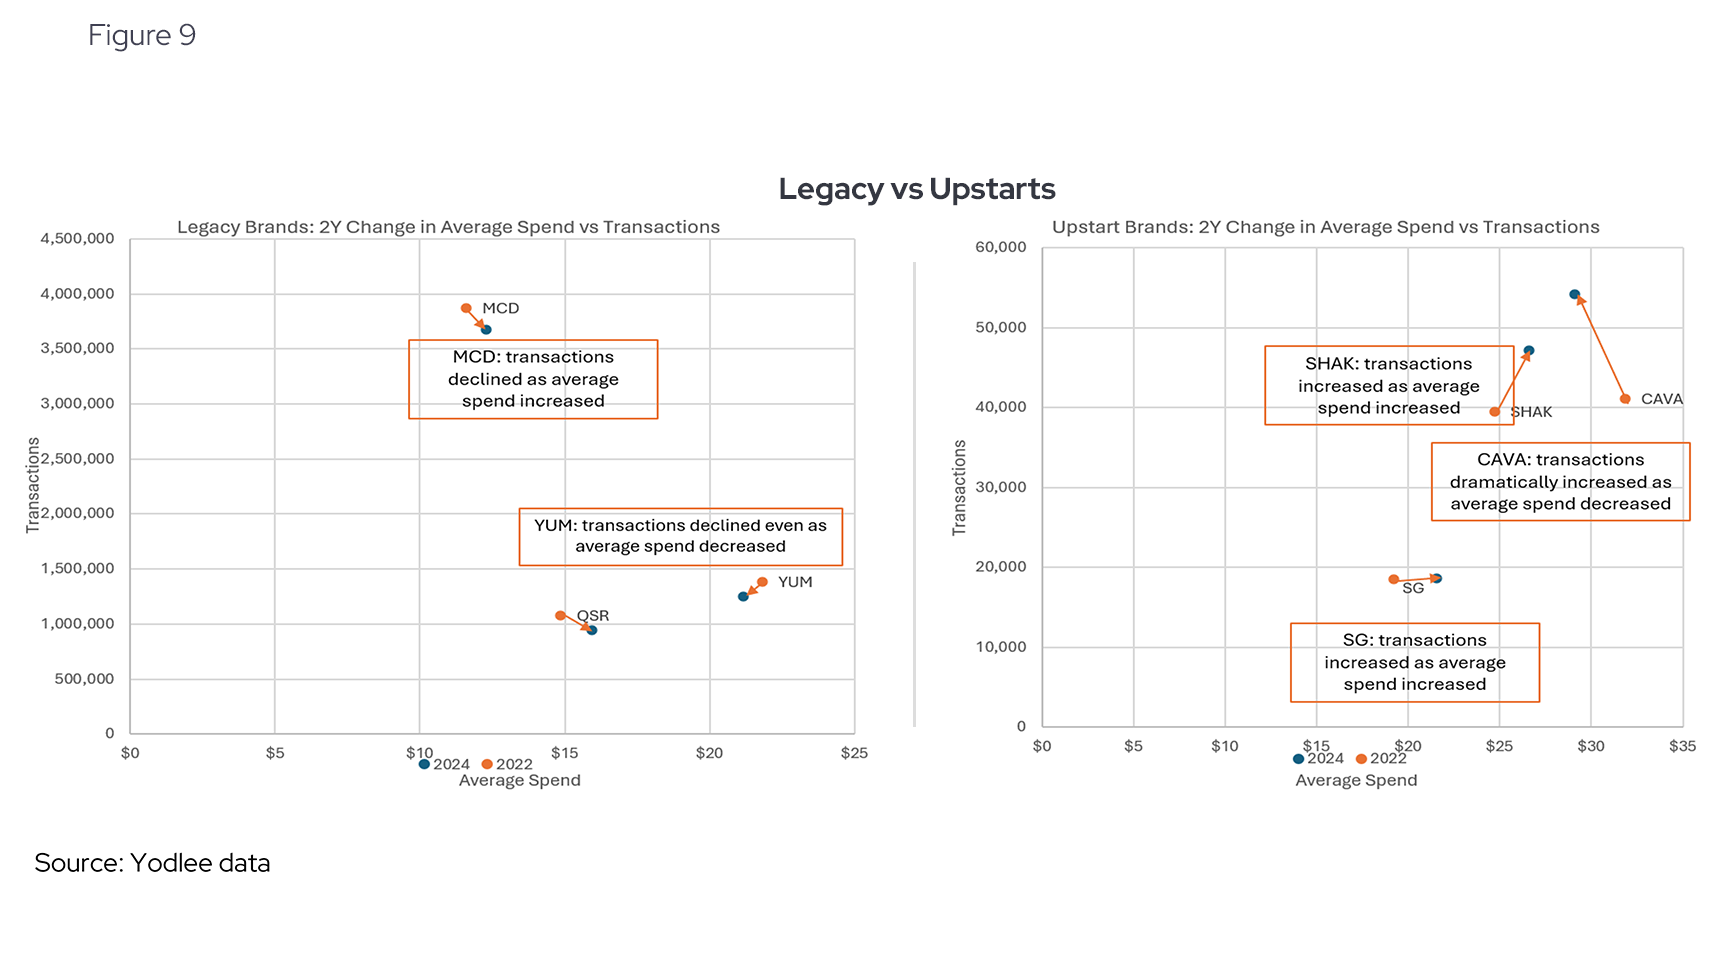
Relatively new concepts (“Upstarts”) such as Cava Group (CAVA US), Sweetgreen (SG US), and Shake Shack (SHAK US) have done better at maintaining transaction volume in lieu of price change. Compare this to their more established (“Legacy”) peers like McDonald’s (MCD US), Yum Group (YUM US), and Restaurant Brands (QSR US). A variety of factors may be coming into play, including menu concepts, starting price points, and a different customer that may be less sensitive to relative changes in price. We can see some of this by comparing the relative decline in either transaction or average spend across these brands, compared to the legacy brands in a 2-year comparison period (see Figure 9):
Will Americans Continue Eating Out?
Keeping a pulse on these changes will be important, especially given heightened fears over recession and slowdown. Will consumers trade down menu items, eat out less, or continue to power through? How effective can changes be at the individual strategy level (special promotions, pricing adjustments, menu alterations)? Having a high-fidelity and high-frequency view into these adapting changes, not only at the ticker level but also the individual brand (public and private) will be crucial for investors in the coming weeks.
Yodlee Data + Intelligence
The analysis in this article is based on a Yodlee dataset comprised of de-identified US credit and debit card transactions. Yodlee Merchant, Retail, Shopper, and Spend Insights utilize de-identified transaction data from a diverse and dynamic set of millions of accounts to identify patterns and context to inform spending and income trends. The trends reflect analysis and insights from the Yodlee data analysis team. By combining data with intelligence – connecting vast amounts of actual de-identified shopping data with state-of-the-art analytics and machine learning – Yodlee provides visibility into daily purchase behavior including transactions, customer lifetime values, and merchant/retailer shares.
Want to see how transaction data can inform your investment process?
Learn more about Yodlee Merchant and Retail Insights and get a free demo from a sales representative.