Online dating has become a cornerstone of modern relationships, with more couples meeting through apps than ever before. However, recent trends in dating app spending, drawn from Envestnet® | Yodlee®'s de-identified transaction data, paint a mixed picture. Over the past five years, consumer spending on these platforms has faced turbulence, with only a few brands standing out amid widespread declines. These shifts highlight the evolving landscape of online dating services and present an intriguing opportunity for investors to assess the industry's future direction.
Our analysis focused on a selection of prominent dating platforms, including public companies such as Match Group ($MTCH), Bumble ($BMBL), and Grindr ($GRND). Match Group, with its vast portfolio of apps like Tinder, Hinge, and Match.com, dominates the space, commanding over 70% of the total market. Meanwhile, Bumble and Grindr target different user demographics and offer alternative engagement models. Yodlee data reveals key spending patterns and growth trends across these platforms, shedding light on where users are spending and what that means for the sector's long-term potential.
Online Dating’s Growing Popularity and Investment Surge
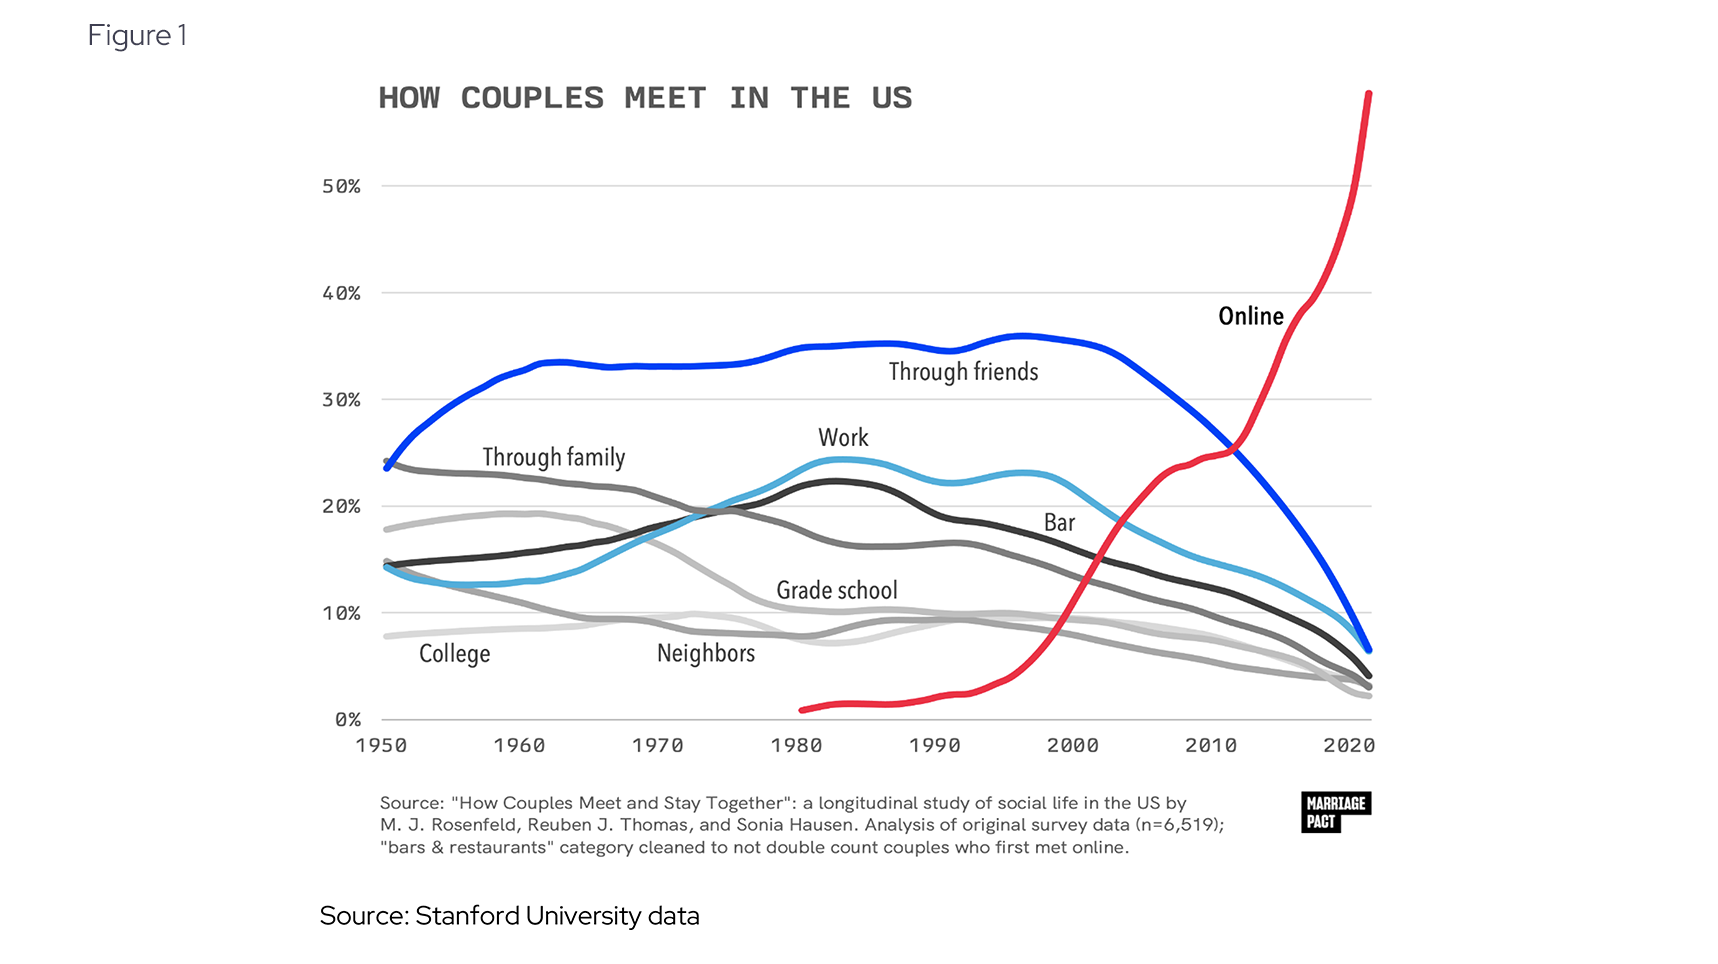
It comes as no surprise that couples now meet online more often than in the past. A Stanford study (see Figure 1) shows the rise of online dating, coinciding with the exploding usage of the internet and mobile devices. Rapid growth in new dating product verticals has drawn investment dollars, and the landscape of online dating services is a dynamic place for investors to focus on.
Several companies are capitalizing on this trend, offering romance seekers an easy and convenient way to meet their potential matches. One company, Match Group, has made a large effort, through its own app and through multiple acquisitions, to capture the lion’s share of the market.
Match Group Reigns Supreme in Online Dating, but Investors Eye What’s Next
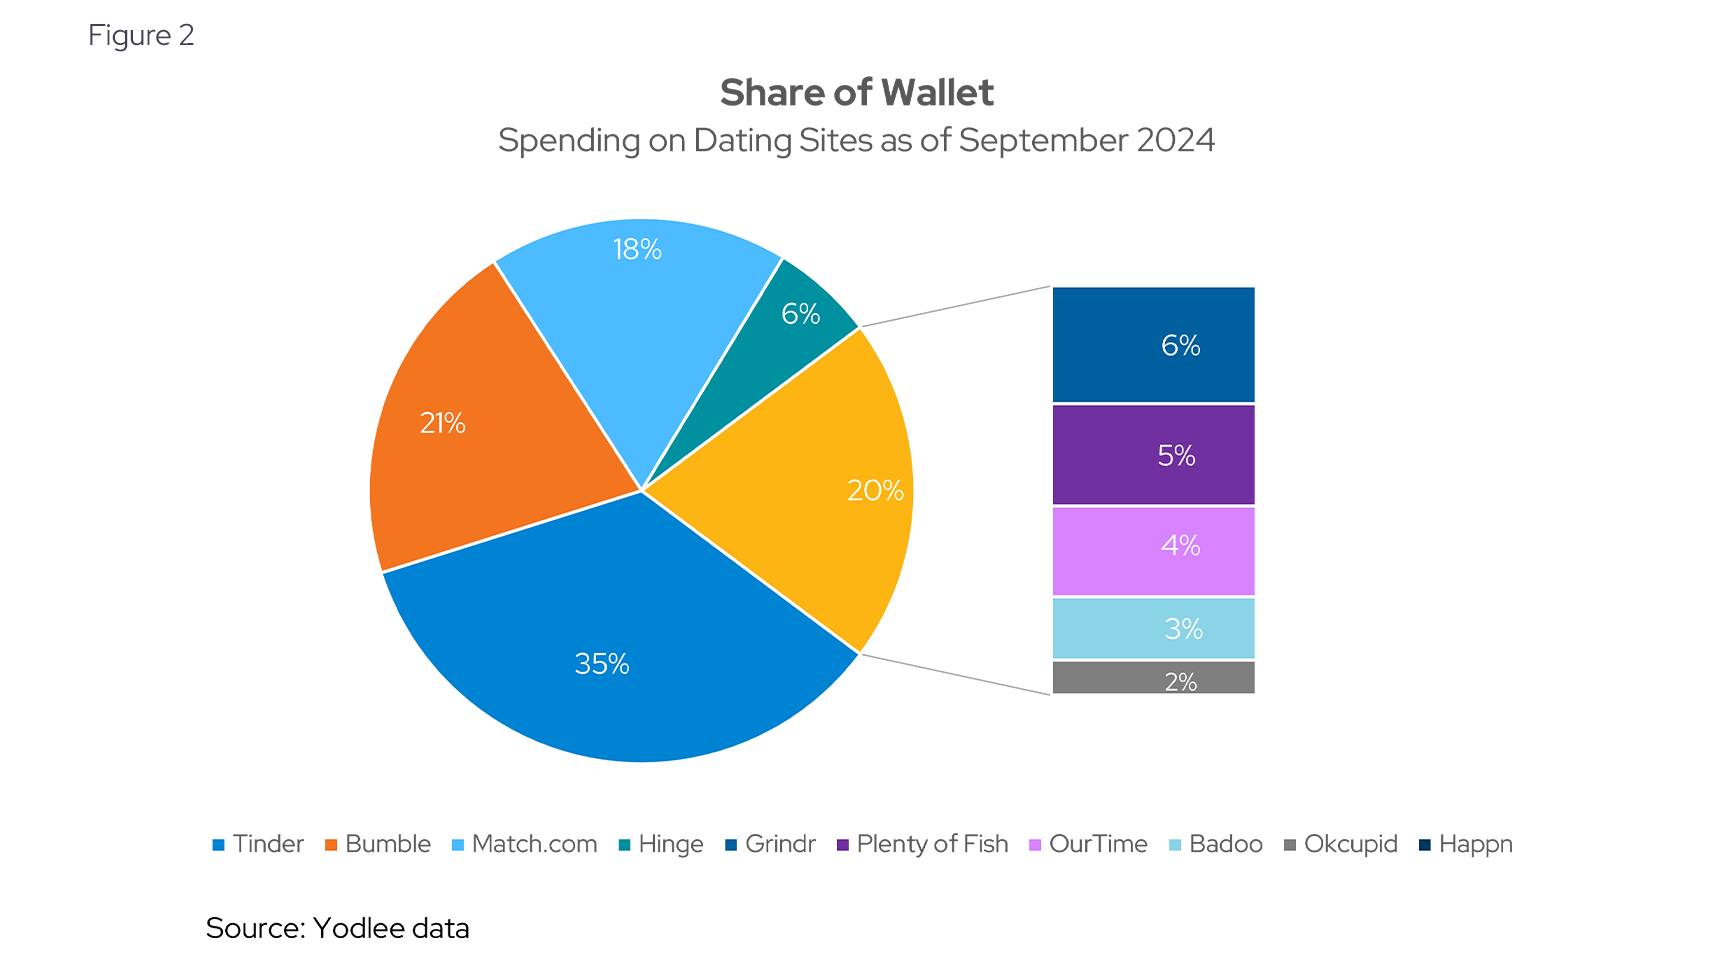
Match Group ($ MTCH US) is the undisputed heavyweight in the domestic online dating ecosystem. While many may think of match’s eponymous dating portal (Match.com), the group also owns Tinder (through a 2017 acquisition), the leader in spend according to Yodlee data, as well as Hinge (a fast-grower in the space), Plenty of Fish, and several other apps.
Together, our data indicates that 70% of total spending in the sector being controlled by Match Group ($MTCH US) and its subsidiaries (see Figure 2). With such a dominant position and an explosive growth backdrop, it may surprise you to know that the stock is down over 70% from its 2021 peak. Some of these acquisitions, namely its largest bolt-on (Hyperconnect), have failed to materialize.
The combination of a dominant position in a high-growth sector, a long history of mergers and acquisitions that requires careful analysis, and a significant drop in stock value provides a unique situation to analyze. As it stands, many investors are wondering “what’s next”. Identifying stabilization and areas of growth with transaction data could help inform their investment view.
Tinder’s Rapid Growth Outpaces Match.com as User Preferences Shift
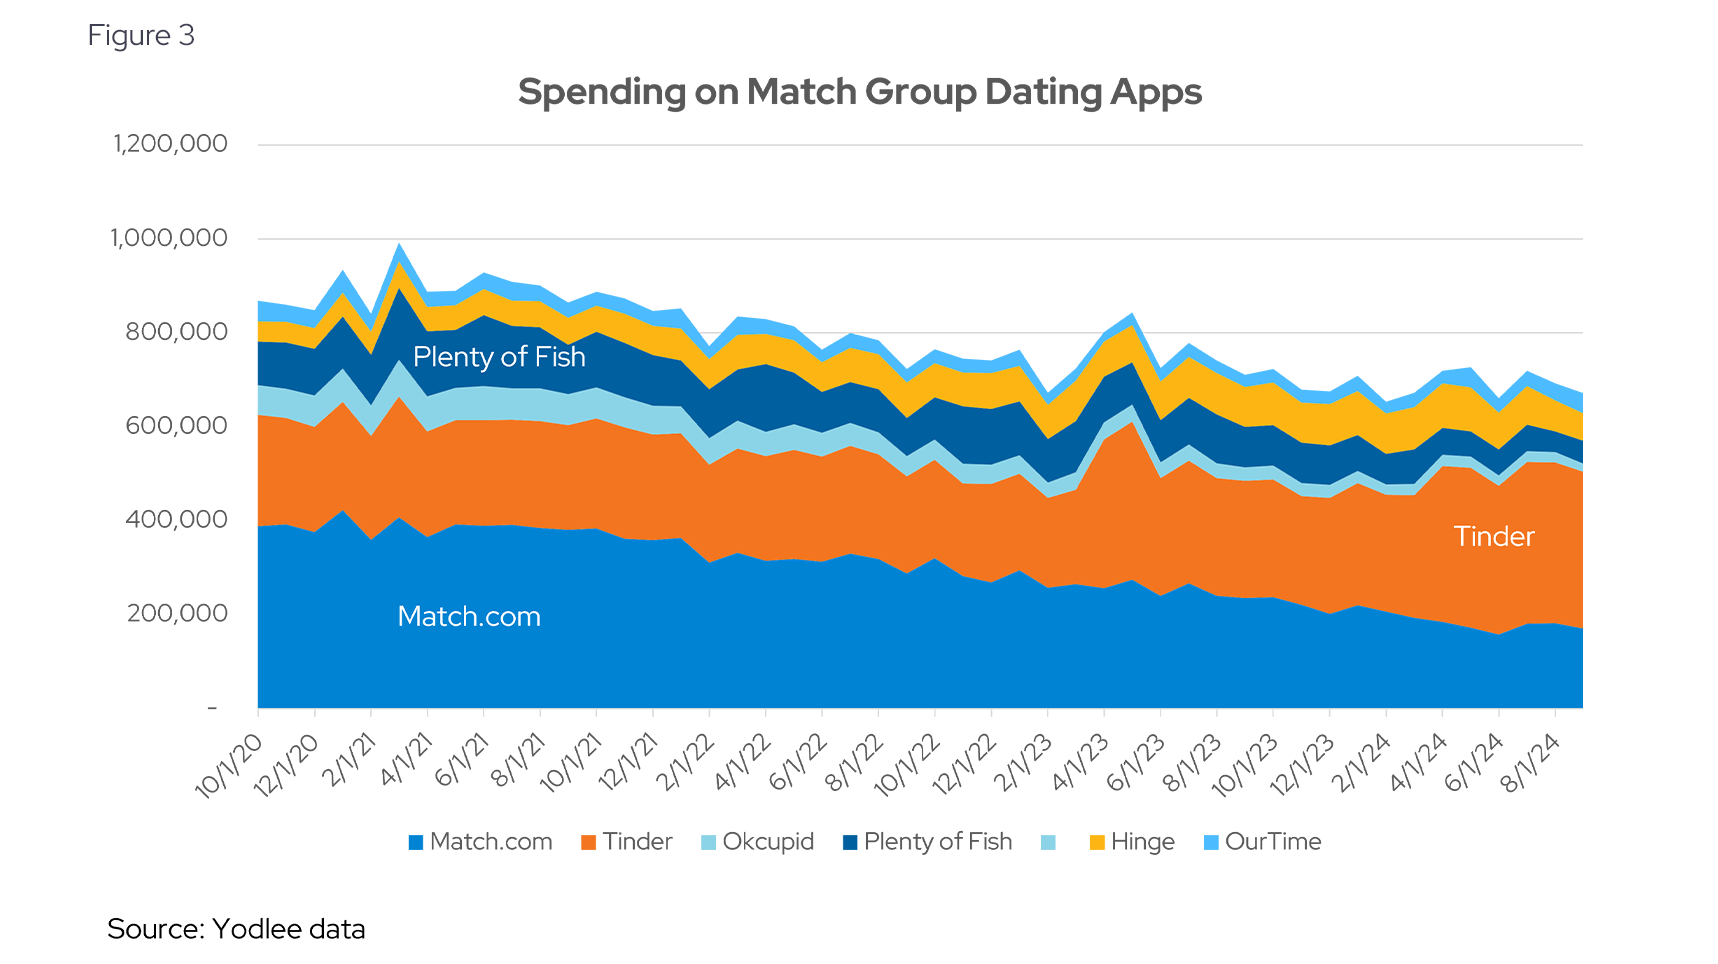
Across the Match Group portfolio, a recent normalization towards Tinder and away from Match.com represents the dominant trend taking hold (see Figure 3). Match.com fits the bill of a more “traditional” online dating portal, based upon implied personality and fit, while Tinder is more visual and interactive, based upon swiping and quick, pithy interaction. With Tinder’s explosive growth, an emphasis on providing premium features to monetize usage seems to have been a focus of management. But this has been tempered by cost rationalization. In their most recent earnings call, management suggested a renewed focus on supportive growth across Tinder, having suffered consecutive quarterly declines.
Tinder Faces Spending Decline, While Hinge and Competitors Show Resilience
To unpack growth, we can clearly see the persistent deceleration of Match.com and the relative strength of Tinder (see Figure 3), which along with competitor Bumble was a beneficiary of COVID, which acted in many ways as an accelerant for online dating. Yodlee data demonstrated a significant deceleration in YOY spend for Tinder heading into the 2nd quarter of 2024, which rebounded into the third quarter.
Compare this aggregate trend to Bumble, Match Group’s closest competitor, and Grindr ($GRND US), another publicly traded company (see Figure 3). Both have different strategies for attracting users, targeting different interactions and demographics. This includes specific portals like Hinge, which require a degree of existing connection, not simply the most deep and liquid market. Management noted that Hinge is a star performer in their portfolio, on course for achieving a billion dollar run-rate.
Niche Dating Apps Thrive by Targeting Specific Communities
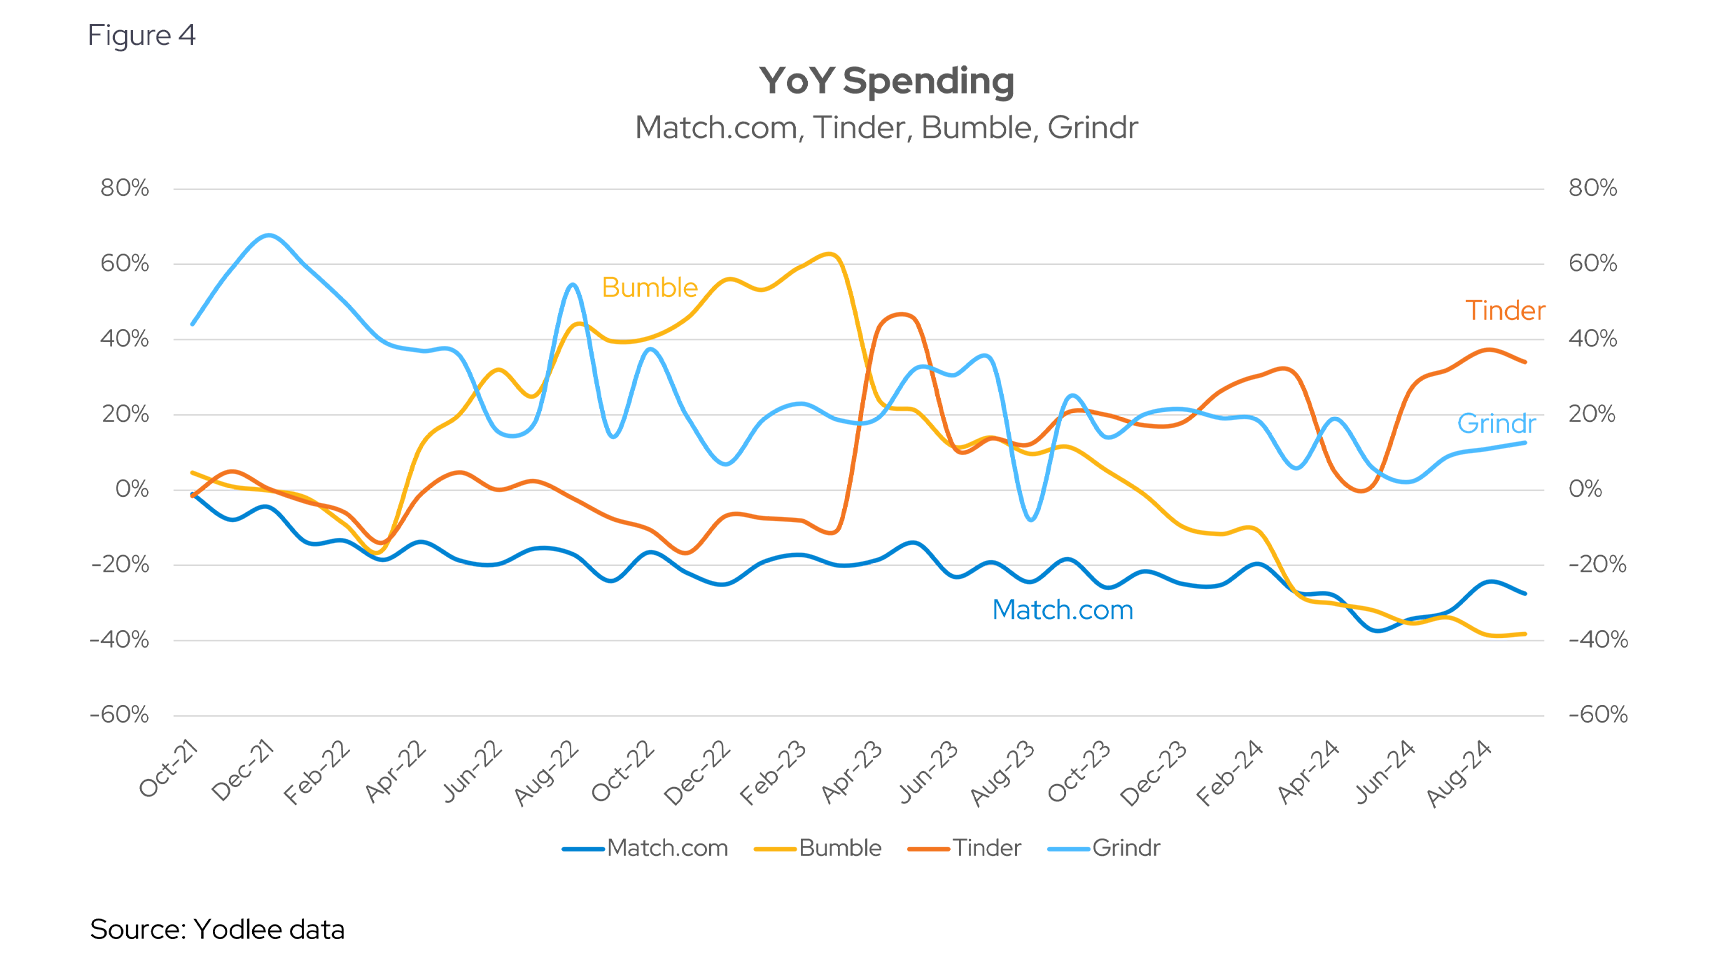
Many competitive brands are targeting “specific communities”, moving away from a mainstream product and one that resonates with targeted affinities. As we can see, YOY growth across Grindr has been robust even as the more mainstream competitors have been more volatile (see Figure 4).
Tinder Fills the Gap as Match.com User Base Declines
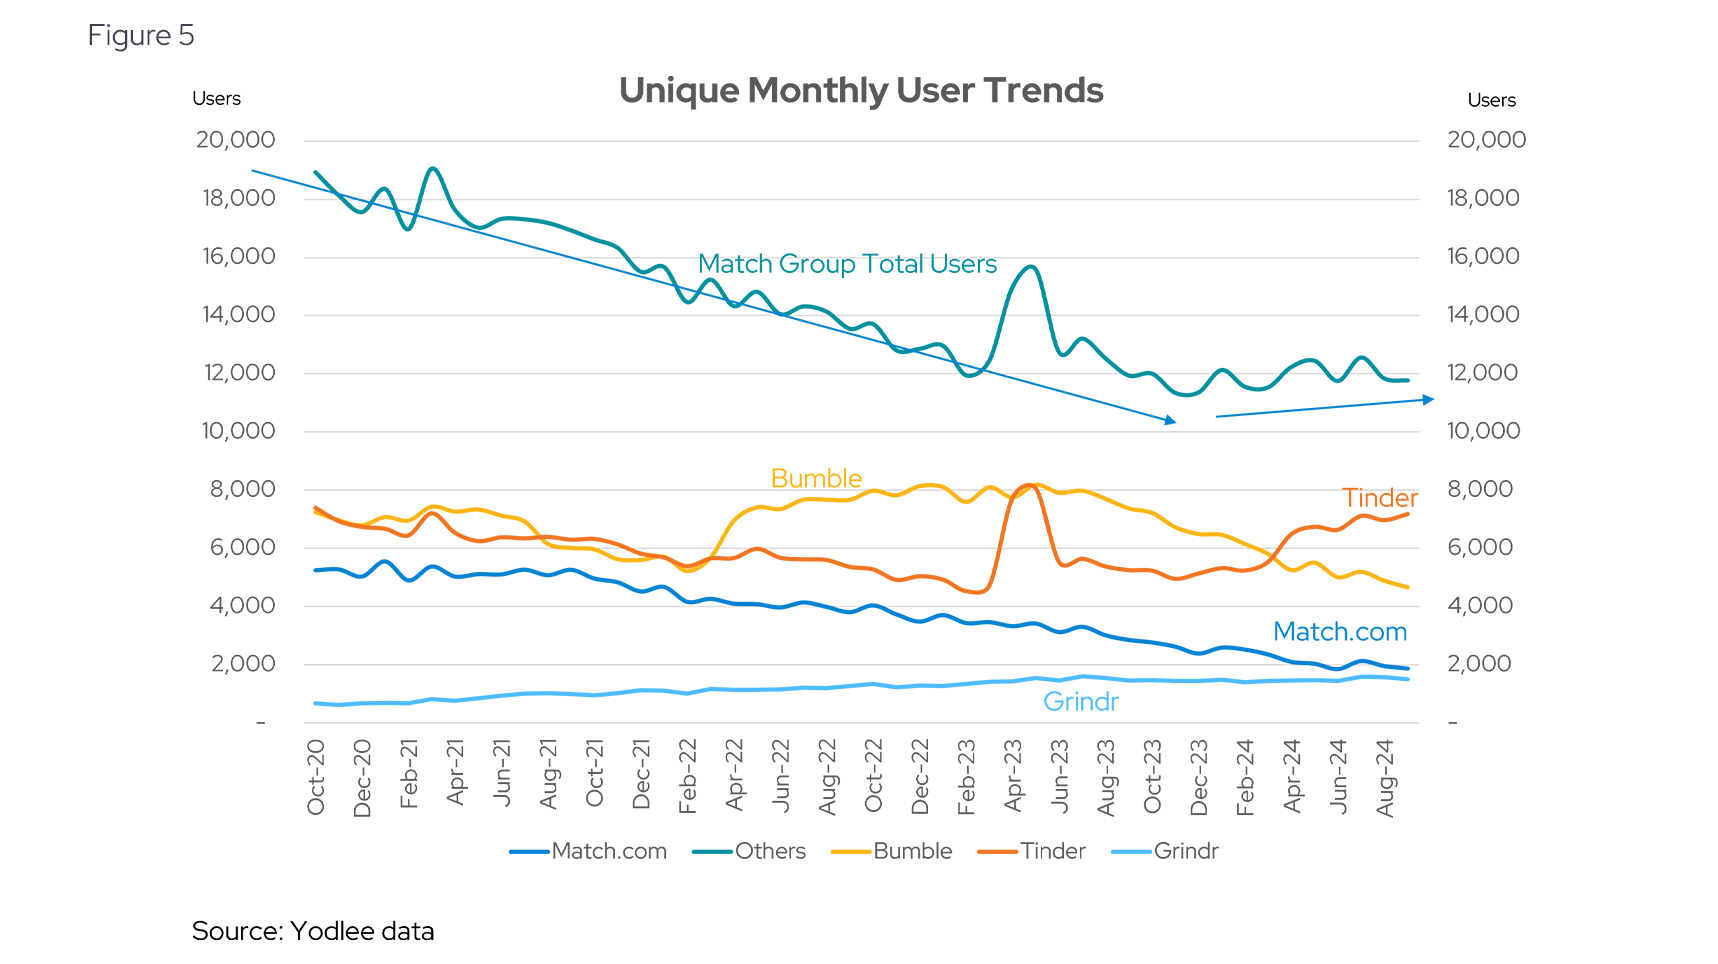
One of the key challenges impacting Match Group's stock performance has been the decline in active users across its platforms. In the world of dating apps, a successful match can ironically reduce the user base, as satisfied customers leave the market. This makes user replenishment a critical focus for sustained growth. Yodlee data reveals a steady drop in usage at Match.com, reflecting this challenge (see Figure 5).
In contrast, Tinder experienced strong growth and a sharp rise in user activity throughout 2024. As the leading app in the online dating landscape, Tinder benefits from a larger, more active user base, providing a richer experience that attracts new members. This success, however, has come at the expense of competitors like Bumble, which has struggled with slowing growth. Bumble's disappointing 2Q24 guidance led to a significant decline in its stock, highlighting the competitive pressures in the space.
Rising Spend Per User Highlights Match Group’s Monetization Focus
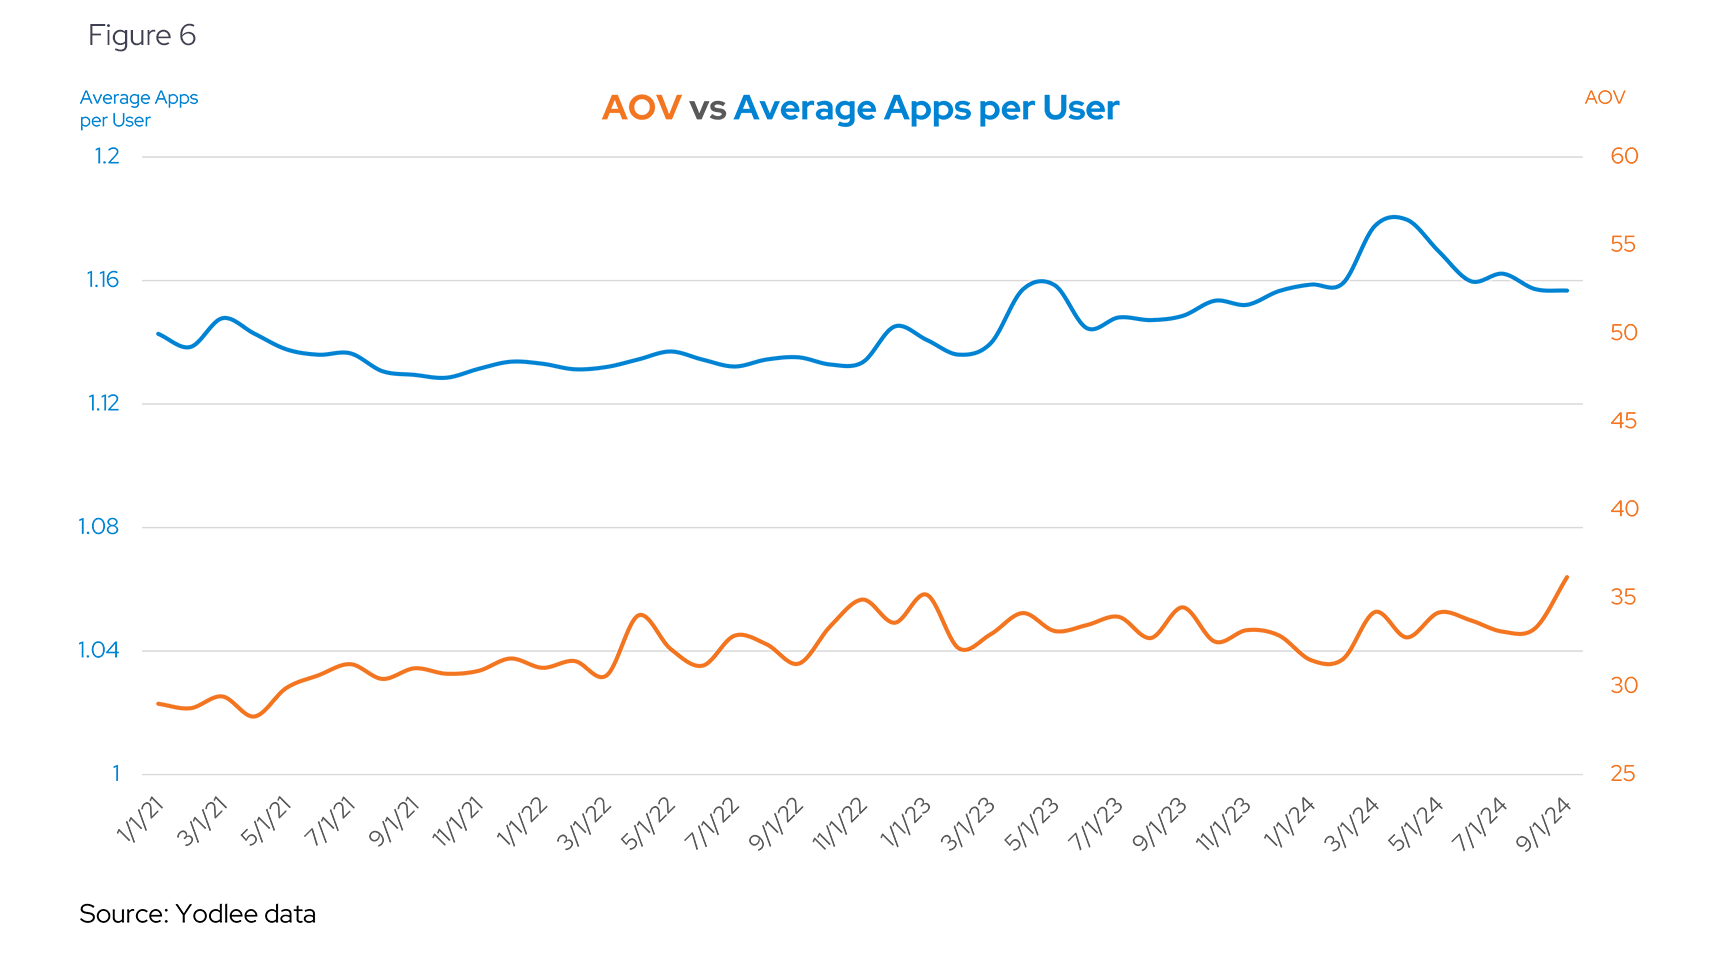
Monetization has seemingly become a stronger focus point for management, as growth has moderated, and operating metrics have come into investors’ focus. As such, features that provide routes towards monetization without increasing churn have been a focus. Management noted an expectation of strong sequential monetization growth to close out the quarter.
According to Yodlee data, average order values (AOV) have increased across Match Group properties, especially in 2024, even as the number of apps that users multi-home with has stabilized (at ~1.15) (see Figure 6). This may drive better operating performance, as long as churn is controlled.
AI and Portfolio Growth Drive Match Group’s Rising AOV Despite Tinder’s Dip
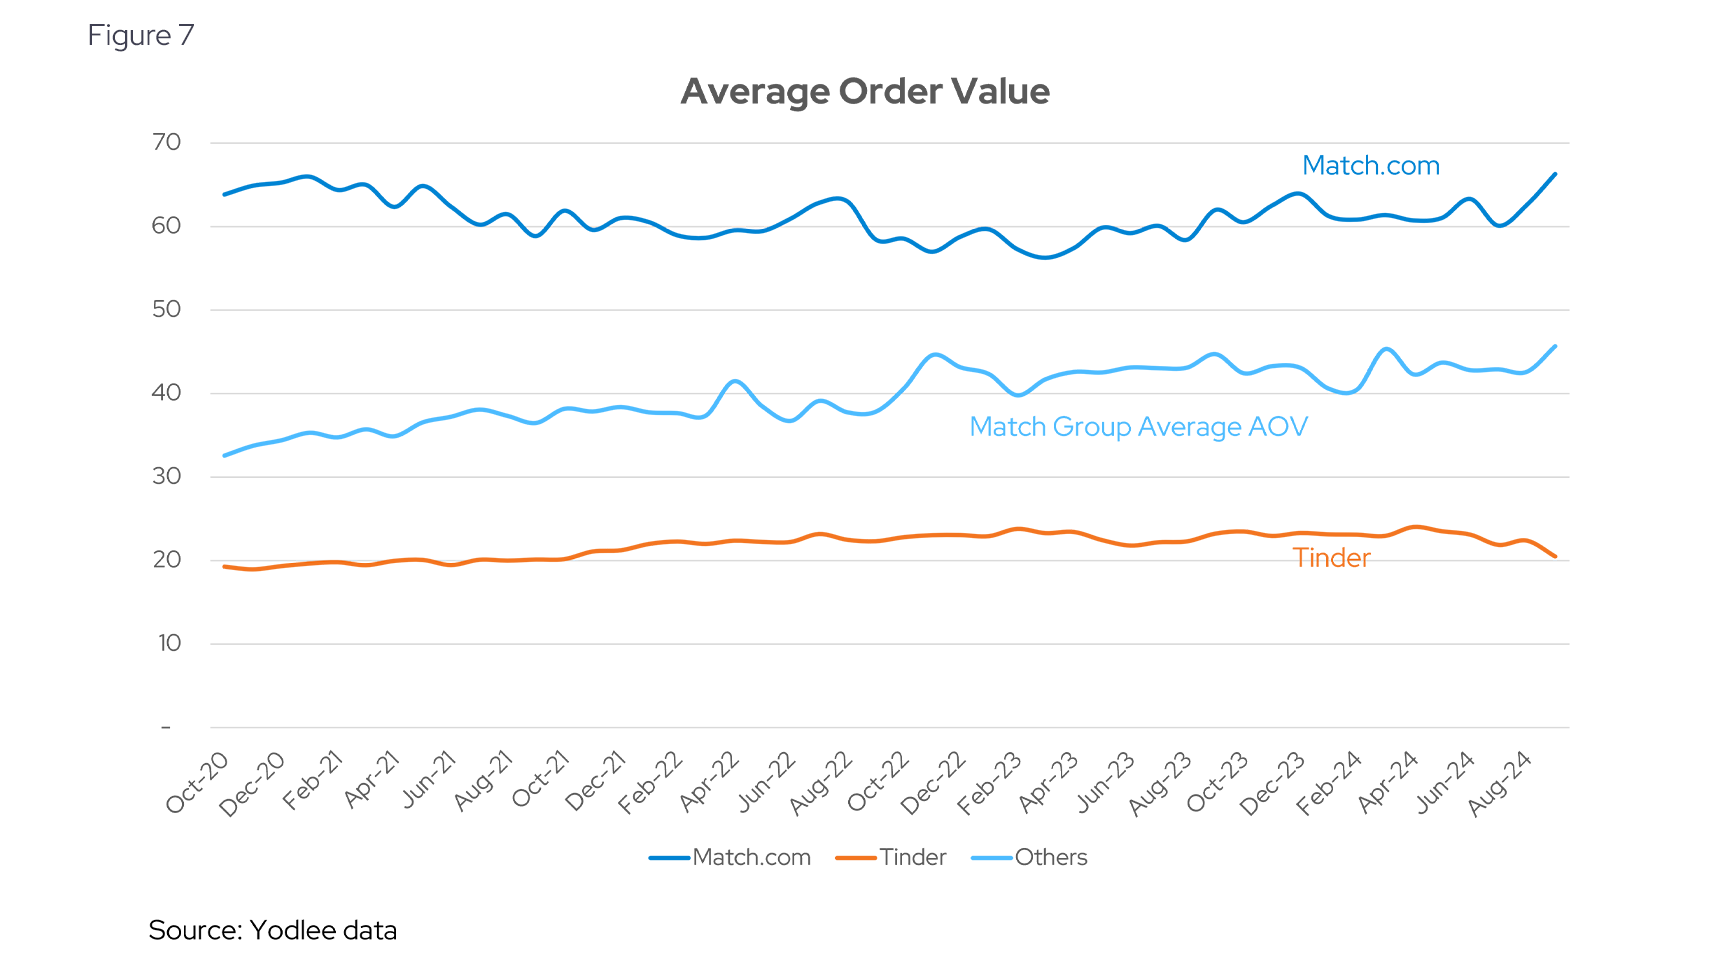
Interestingly, AOVs have recently fallen for Tinder while increasing across the broader portfolio of Match Group apps, including legacy Match.com. Management has noted that the “ecosystem cleanup” of Tinder led to nonlinear results, which they anticipate will pay off heading into 2025. The company is also making investments into AI as a “copilot” for users to navigate initial interactions with potential matches, another channel of potential monetization.
Navigating the Uncertainty: Can Match Group Sustain Growth Amid Volatility?
The data reveals a space that has rapidly consolidated with a strong tailwind of growth that has run into turbulent growth and declining revenue trends. This volatility has somewhat abated into 2024, but the key question remains: can Match Group, with its consolidated position, continue to monetize its service while maintaining relevance across a fickle consumer? Are the most recent dips in AOVs, as demonstrated by our high-fidelity data, a troubling detour from that path? Investors are clearly interested, and Yodlee data can serve as a unique tool in their analytical toolbox.
Want to see how transaction data can inform your investment process?
Learn more about Envestnet | Yodlee Merchant and Retail Insights and get a free demo from a sales representative.
About Envestnet | Yodlee Merchant, Retail, Shopper, and Spend Insights
Envestnet | Yodlee Merchant, Retail, Shopper, and Spend Insights utilize de-identified transaction data from a diverse and dynamic set of data from millions of accounts to identify patterns and context to inform spending and income trends. The trends reflect analysis and insights from the Envestnet | Yodlee data analysis team. By combining data with intelligence – connecting vast amounts of actual de-identified shopping data with state-of-the-art analytics and machine learning – Envestnet | Yodlee provides visibility into a large set of shopping daily purchase behavior including, but not limited to, transactions, customer lifetime values, and merchant/retailer shares.


