Back-to-school is a key shopping season for retailers, second only to the holidays. This year, rising prices have made it challenging for stores to attract consumers. According to a recent KPMG survey, 38% of consumers feel financially worse off than last year, with younger and lower-income shoppers particularly affected.
Using Envestnet | Yodlee’s transaction data, we examined spending across 250 brands, including major players like Target (TGT US), Amazon (AMZN US), Dollar General (DG US), and Sketchers ($SKX). Looking at typical back-to-school categories of Apparel, Department Stores, Footwear, Office Supplies, Ecommerce, Specialty Goods, Wholesale, and Sportswear, we explored monthly spending trends, market share dynamics, transaction counts, and order values, shedding light on consumer appetite during this back-to-school season. The article builds on our prior report on retail brands published earlier this summer.
Confidence Rises, But Back-to-School Budgets Tighten
While consumer confidence increased overall in August for a second month straight, it actually declined for a large swath of the US population, including younger consumers and lower income demographics. The Conference Board’s Consumer Confidence Index® has reached a six-month high at 103, but it remains lower than last year's level of 110.
Heading into the back-to-school season, the National Retail Federation (NRF) was expecting a 6.5% decrease in aggregate spending, representing a more modest 1.7% decrease in per household spending. The difference could be partially driven by a decline in the number of K-12 households in the country.
Back-to-School Spending Sees a Notable Drop
In aggregate, Yodlee data suggests a total spending trend that echoes comments by the NRF, which may not underly the economic strength recent aggregate retail figures have put out but does reflect a decline in back-to-school spending. Our aggregate shows a 5.8% decline for August 2024, compared to August of last year (see Figure 1). Worryingly, the blue line demonstrating year-over-year change shows a marked deceleration, akin to that of the first quarter of 2022.
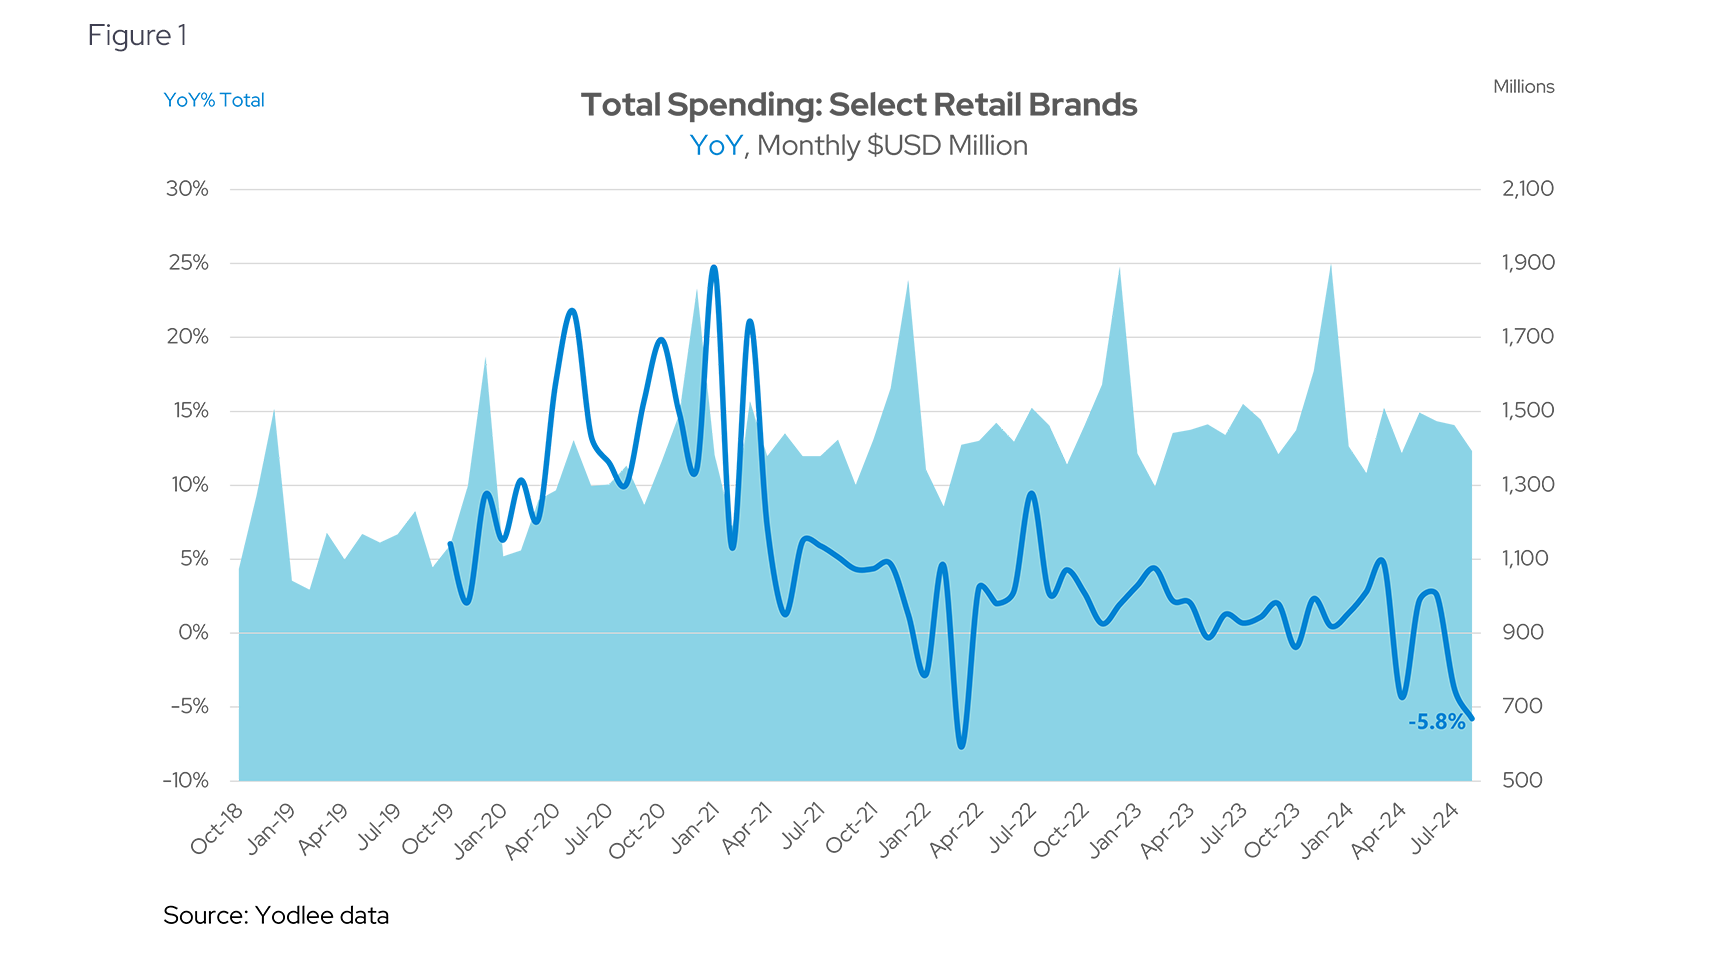
Perhaps some of this decline is a give-back of the dramatic increase in back-to-school spending from 2019-2023. The period saw a near 60% increase in spend, according to NRF. The post COVID recovery may have prompted many households to upgrade their kids’ wardrobes and accessories. Inflation passthrough is, of course, an important driver as well.
Online Shopping Holds Strong, But Gains Are Slowing
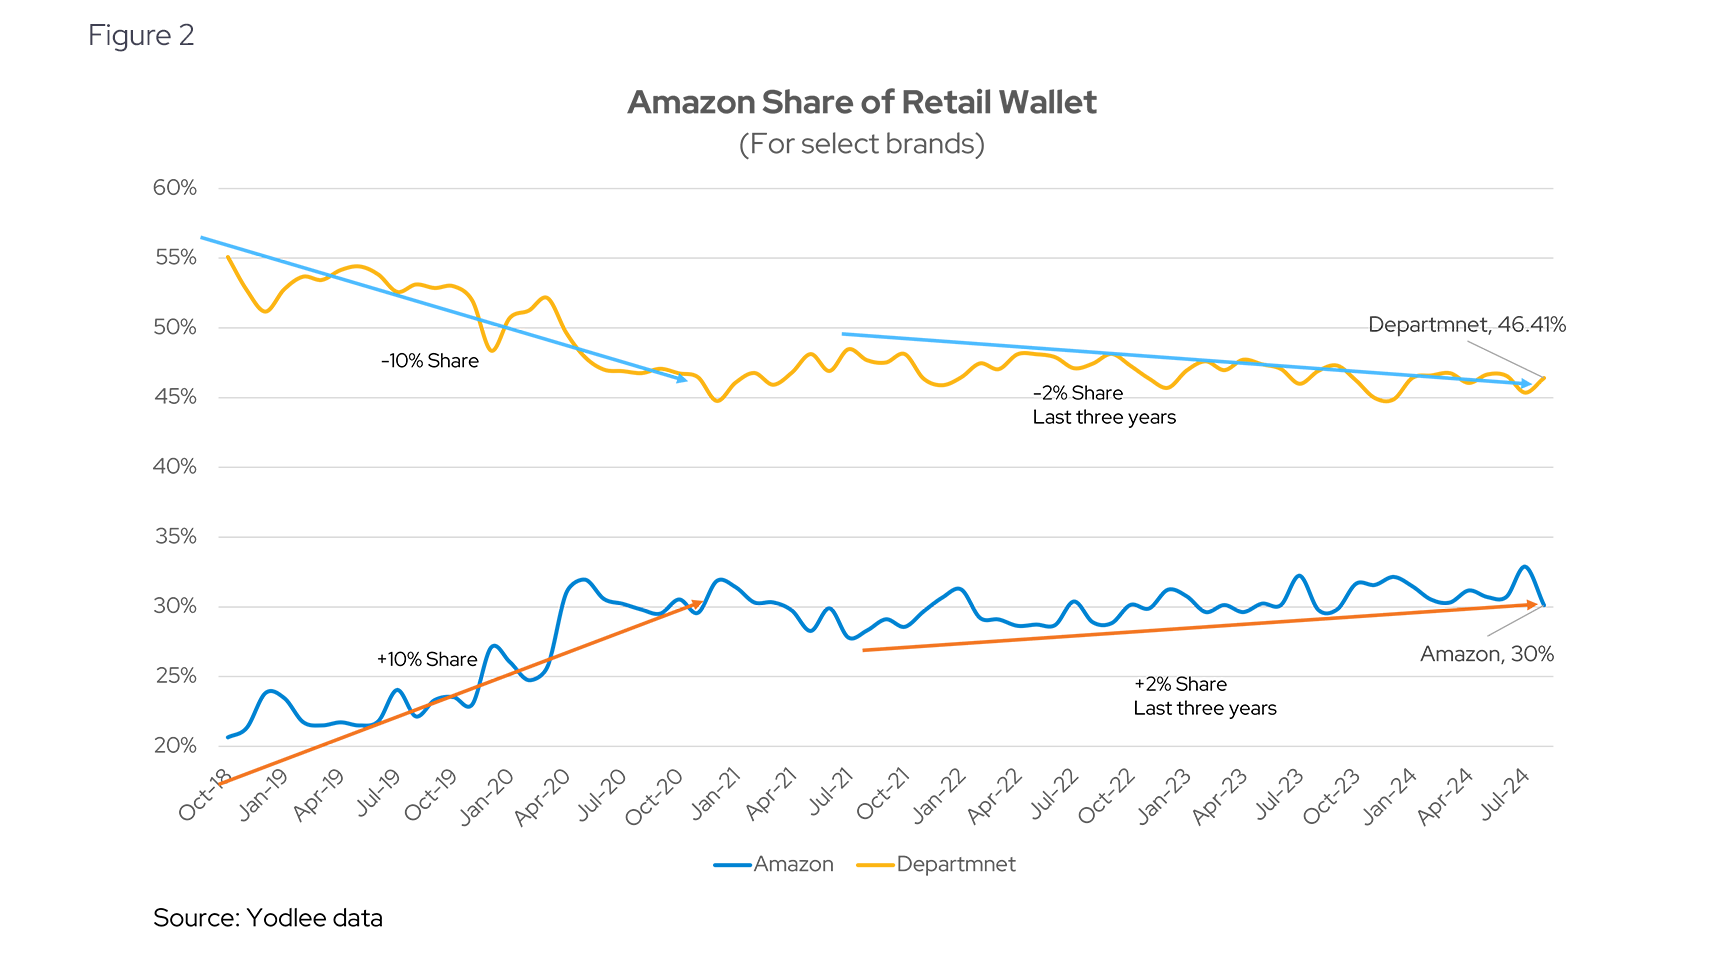
As a backdrop for consumer spend, one might assume that the rise in e-commerce is a big factor in back-to-school spending. While the migration of consumer shopping toward e-commerce versus brick-and-mortar has been playing out for years, it has recently slowed after the acceleration witnessed during COVID. Our data shows that (for our select brands) most of the shift in wallet share happened in 2018 – 2020 (see Figure 2):
Back-to-School Spending Patterns Shift Toward New Priorities
With an upgrade cycle underway in the post COVID back-to-school seasons of 2021-2023, the question is whether consumer spending will maintain a similar pattern, or compositionally change. An analysis of the data points to significant shifts in consumer back-to-school spending.
One such trend to watch is a shift toward electronics. An International Council of Shopping Centers (ICSC) consumer survey suggests that more back-to-school shopping is being directed toward electronics, versus spending on traditional paper supplies. This broadly mirrors an increase in the number of tech-enabled learning tools used across school districts.
The digital transformation of K-12 education may be leading to lower annual spend on consumables such as notebooks, pen, and paper, and more on devices such as tablets and laptops.
The trend towards increased electronics / lower paper consumables may also overlap with the change in consumer behavior noted during various retailers’ 2Q earnings announcements. A split was pronounced when comparing retailers targeting different levels of affluence. We see this across our Yodlee data capture with a noted deceleration in transactions and spend across the so-called “dollar stores”, versus relative strength in more diversified “premium” retailers that also cater to electronics.
This was corroborated in 2Q24 earnings calls. Compare Dollar General, which described their customers as “financially constrained,” versus Target (TGT US), which noted “a consumer that is still willing and able to spend.” The shift towards electronics and away from cheaper consumables (like notebooks) has overlapped with the economic impact of inflation across different income brackets. The result has been significant relative weakness in dollar store retailers such as Dollar General (DG US) and Dollar Tree (DLTR US) (see Figure 3):
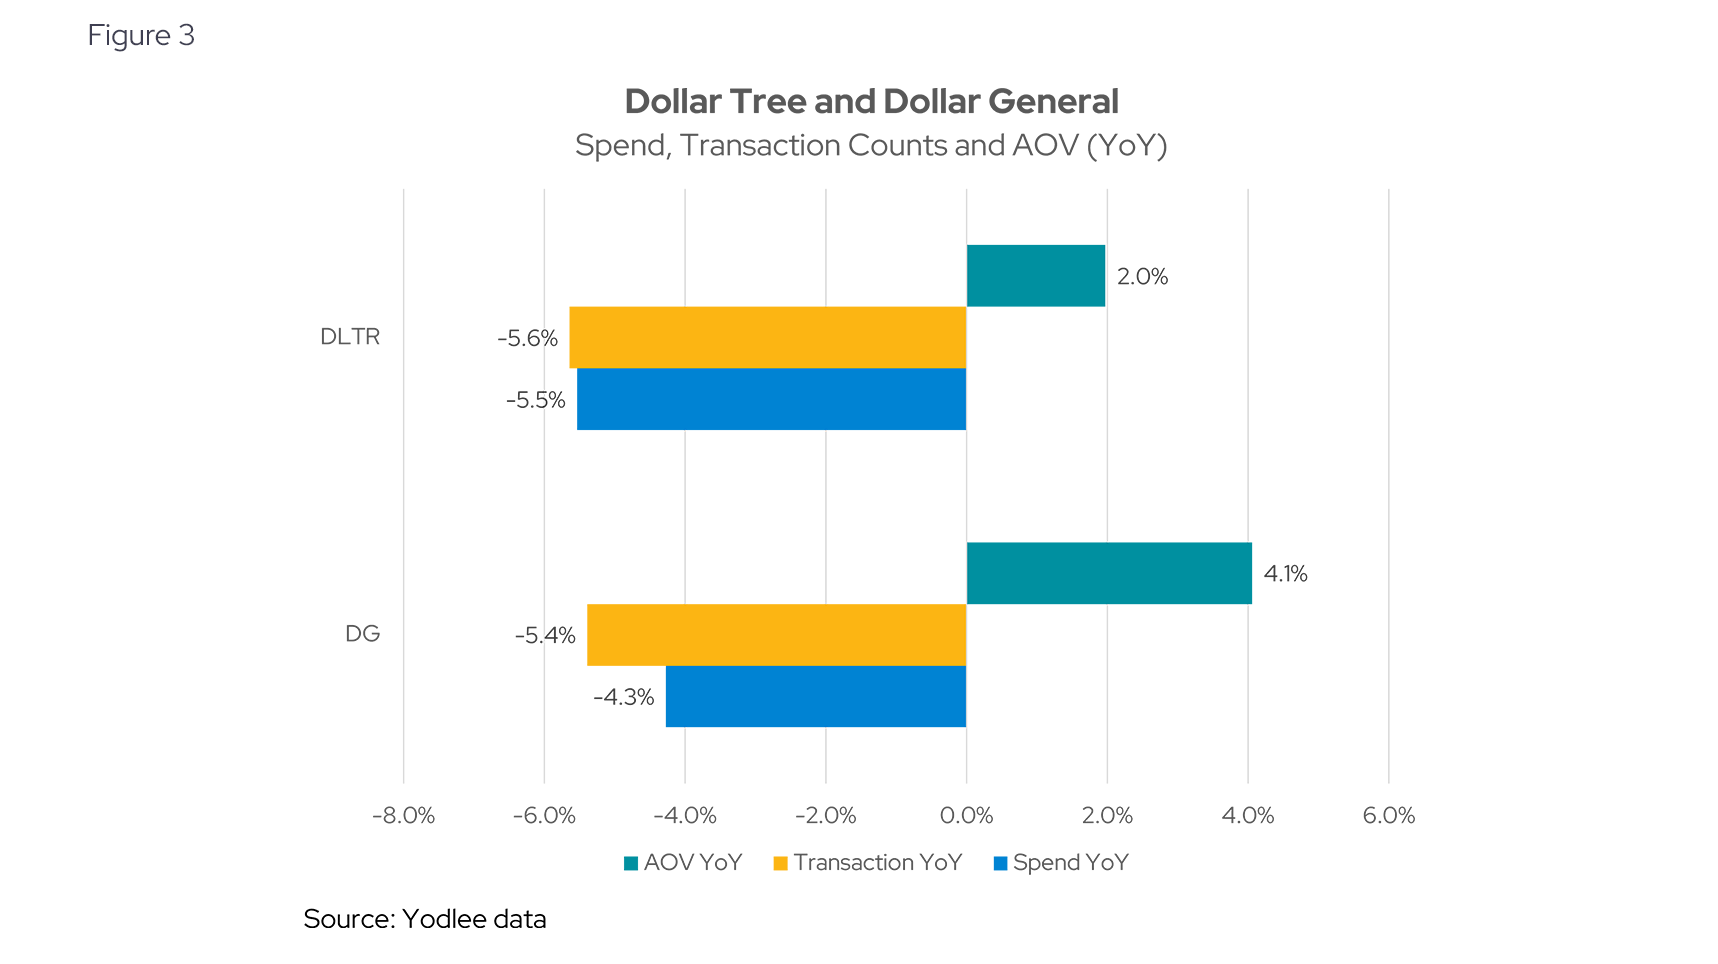
The data suggests that even as dollar stores passed on inflation to consumers, as indicated by an increase in average order value (AOV) (green bars in Figure 3), their transaction slipped over 5% from 2023. This resulted in a decline in total spending (blue bars in Figure 3). This dynamic is like that of other retail sectors we have analyzed.
Cautious Consumers Skip the Wardrobe Refresh
NRF’s survey also suggested a back-to-school deceleration across apparel, with flat spending on footwear. This broadly follows various macroeconomic indicators of retail sales for these two categories. While kids cycle through footwear more quickly than adults, this may represent a consumer who doesn’t want to spend as heavily on a refreshed wardrobe, especially in the backdrop of increased consumer prices.
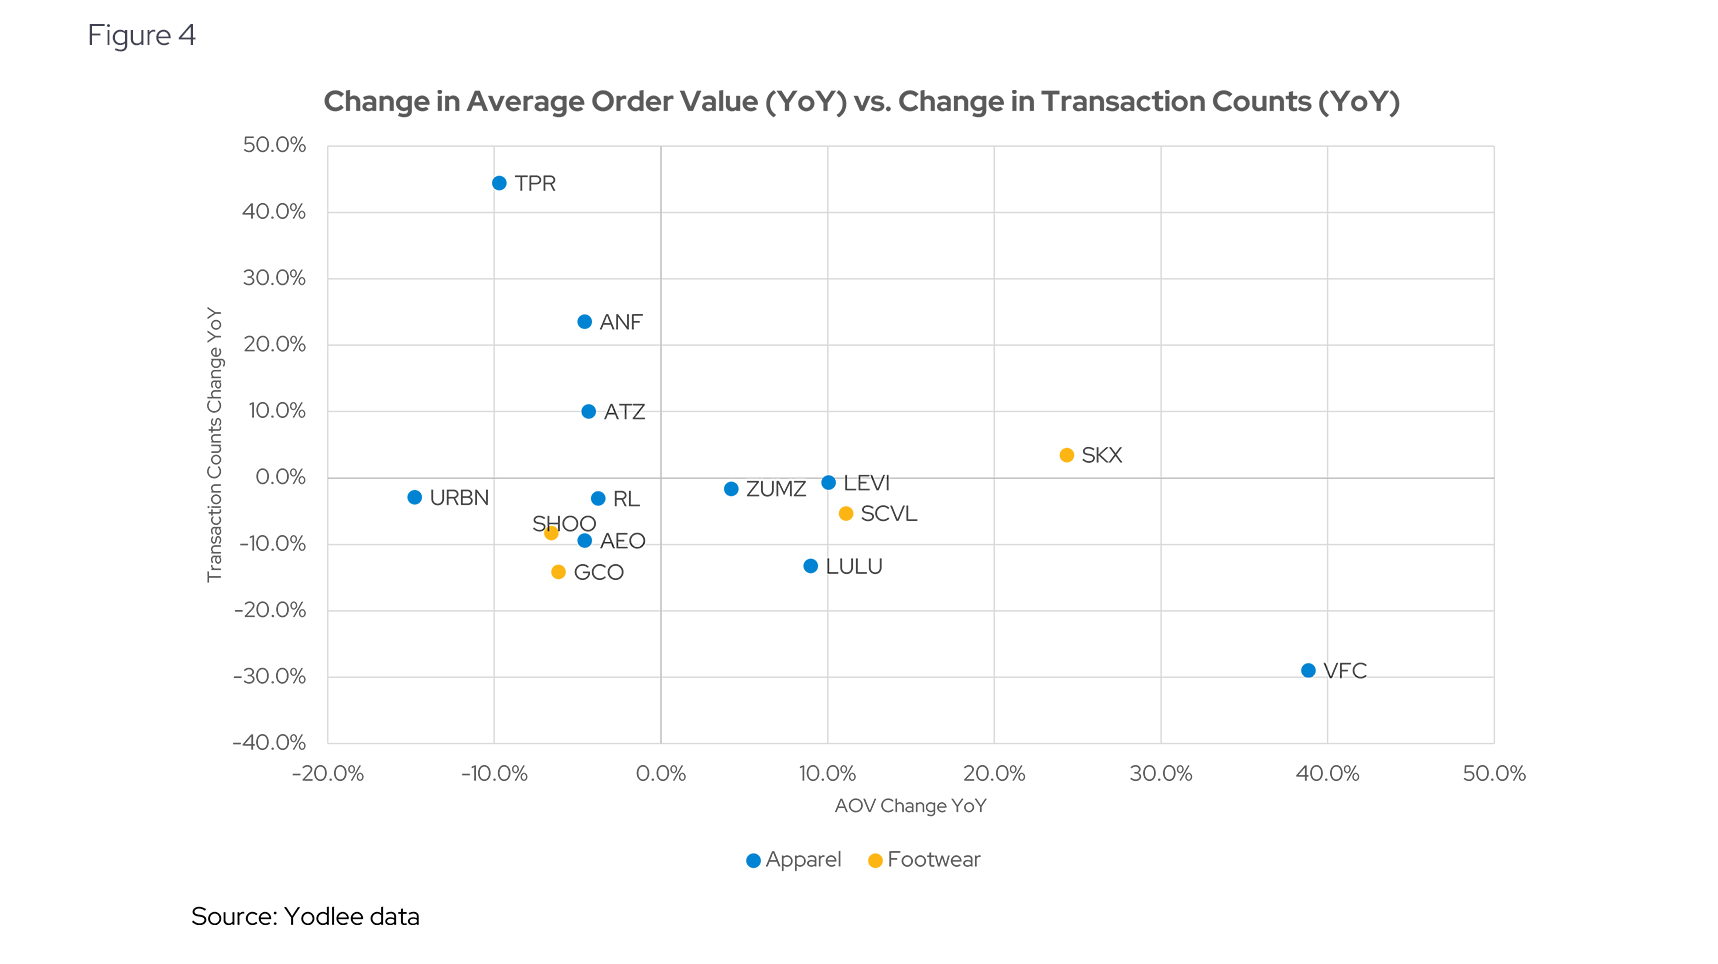
Few apparel and footwear brands have been able to maintain an increase in average transaction value (a proxy for price) with increases in the breadth of transactions (setting aside store-expansion). Sketchers (SKX US) sticks out as a brand who has been able to do so during this back-to-school season, compared to other footwear brands such as Genesco (GCO US) (see Figure 4).
Spending Shifts as Consumers Feel Financial Pressure
It’s clear that this year's back-to-school season reflects a more cautious consumer landscape, driven in part by economic uncertainty. While total spending shows a decline, the shift towards technology over traditional school supplies highlights evolving educational priorities, particularly among higher-income cohorts. Retailers catering to premium electronics saw relative strength, whereas those focused on lower-income demographics and more traditional merchandise faced challenges – reflecting the types of consumers who are feeling more economic pressure.
The aggregate data reveals a complex picture of consumer behavior, signaling a mixed outlook for retailers during this critical shopping period. Will retailers perform in Q3 earnings, and what does this portend for the critical holiday season? Will holidays buckle the trend and see consumers open up their purses? We’ll be tracking the data closely.
Want to see how transaction data can inform your investment process?
Learn more about Envestnet | Yodlee Merchant and Retail Insights and get a free demo from a sales representative.
About Envestnet | Yodlee Merchant, Retail, Shopper, and Spend Insights
Envestnet | Yodlee Merchant, Retail, Shopper, and Spend Insights utilize de-identified transaction data from a diverse and dynamic set of data from millions of accounts to identify patterns and context to inform spending and income trends. The trends reflect analysis and insights from the Envestnet | Yodlee data analysis team. By combining data with intelligence – connecting vast amounts of actual de-identified shopping data with state-of-the-art analytics and machine learning – Envestnet | Yodlee provides visibility into a large set of shopping daily purchase behavior including, but not limited to, transactions, customer lifetime values, and merchant/retailer shares.