The pandemic fueled a boom in pet adoption as Americans sought companionship during lockdowns. Expanding on our previous post showing sales, transactions, and user trends in the pet industry from 2020-2024, we now examine year-over-year (YoY) data on wallet share and consumer spending. This analysis digs into three major categories across more than 80 brands – pet supplies, pet sitting and boarding, and pet care and insurance. Trends emerge on where pet parents are prioritizing their dollars, and which brands are leading the pack.
Utilizing Envestnet®| Yodlee® de-identified transaction data, our analysis highlights many prominent brands. In the pet supply category that includes Chewy (CHWY), PetSmart, Petco (WOOF), Pet Supplies Plus, The Farmer’s Dog, Inc., and BarkBox. The Pet sitting and boarding category features insights on Rover.com (ROVR), Camp Bow Wow, Petsuites, Time To Pet, and Canine Country Club. Major brands in the pet care and insurance category included Banfield Pet Hospital, VCA, Trupanion (TRUP), Pets Best Insurance, Healthy Paws, Fetch Inc., PetIQ (PETQ), and Spot Pet Insurance.
Pet Supplies Dominate the Market

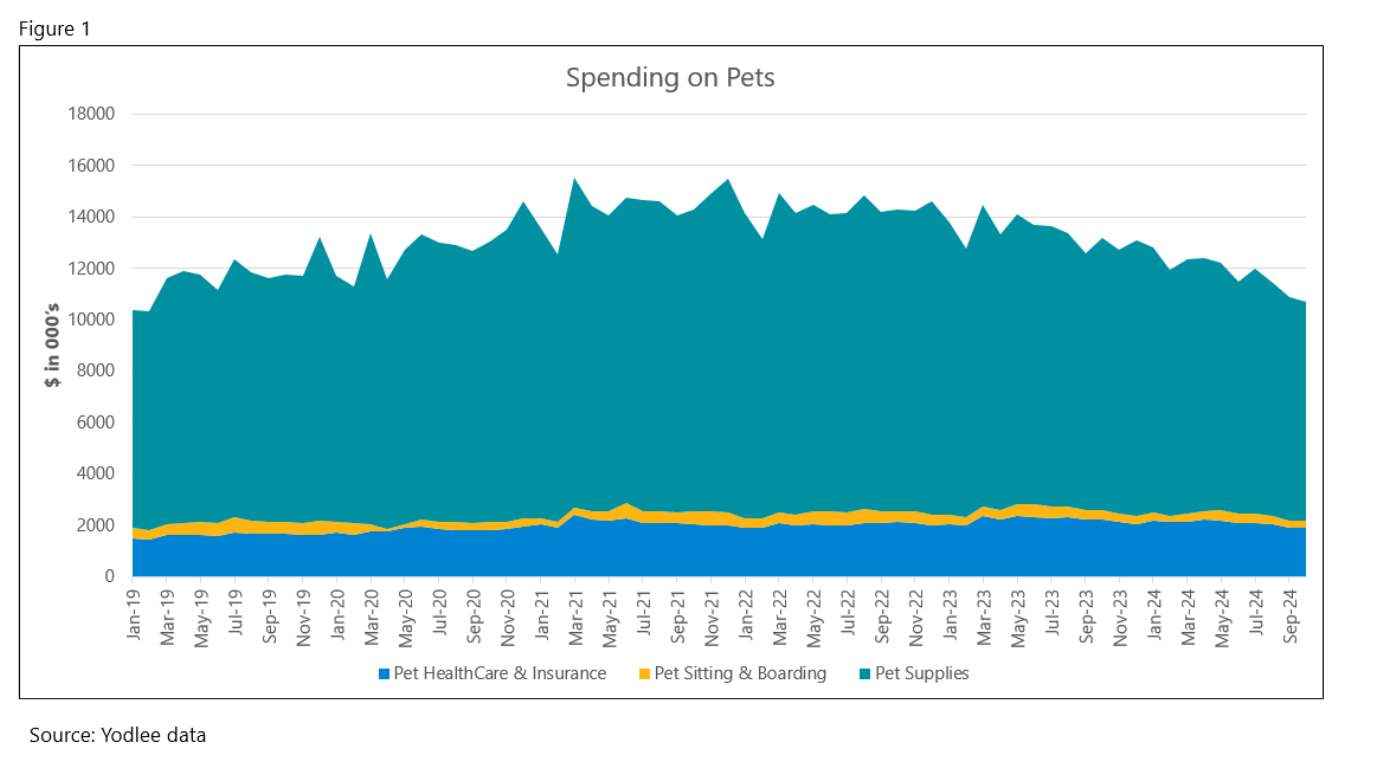
Our analysis of consumer spending trends across the pet industry suggests striking differences between categories (Figure 1). Pet Supplies represent the largest slice of the market, spanning essentials such as food to accessories and toys for a diverse range of products pet parents may want or need. Yodlee data suggests that Pet HealthCare and Insurance was the next largest spending category, capturing pet well-being from veterinary care to insurance plans. Pet Sitting and Boarding seems to be the smallest segment yet appears steady.
Pet Supplies: Steady Growth in Everyday Essentials

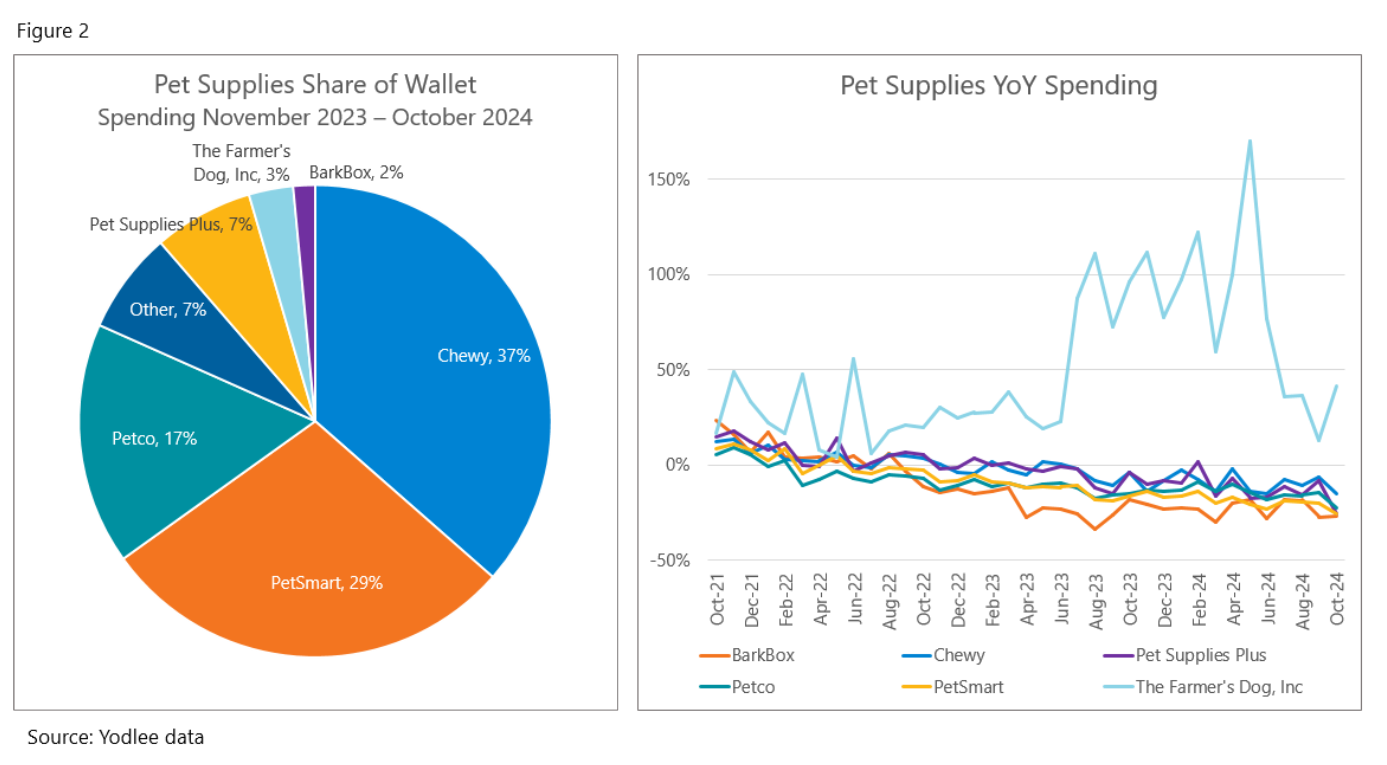
For the period of November 2023 through October 2024, Chewy led the market with the highest share of wallet among the brands analyzed at 37% (see Figure 2). Its YoY spending performance suggests that spending is consistently at the upper end of the peer group exhibiting a slight decline and relative stability (see Figure 2).
PetSmart and Petco were also strong players during that period. YoY spending for both brands suggests a slightly sharper decline versus peers. While The Farmer's Dog appears to capture just 3% of share of wallet, the data suggests that it significantly outperformed larger brands in YoY spending growth. The Farmer’s Dog, which offers fresh, human-grade dog food, could be aligning with industry trends tilting towards premium pet food options.
Pet Sitting and Boarding: Shifting Trends in Pet Services

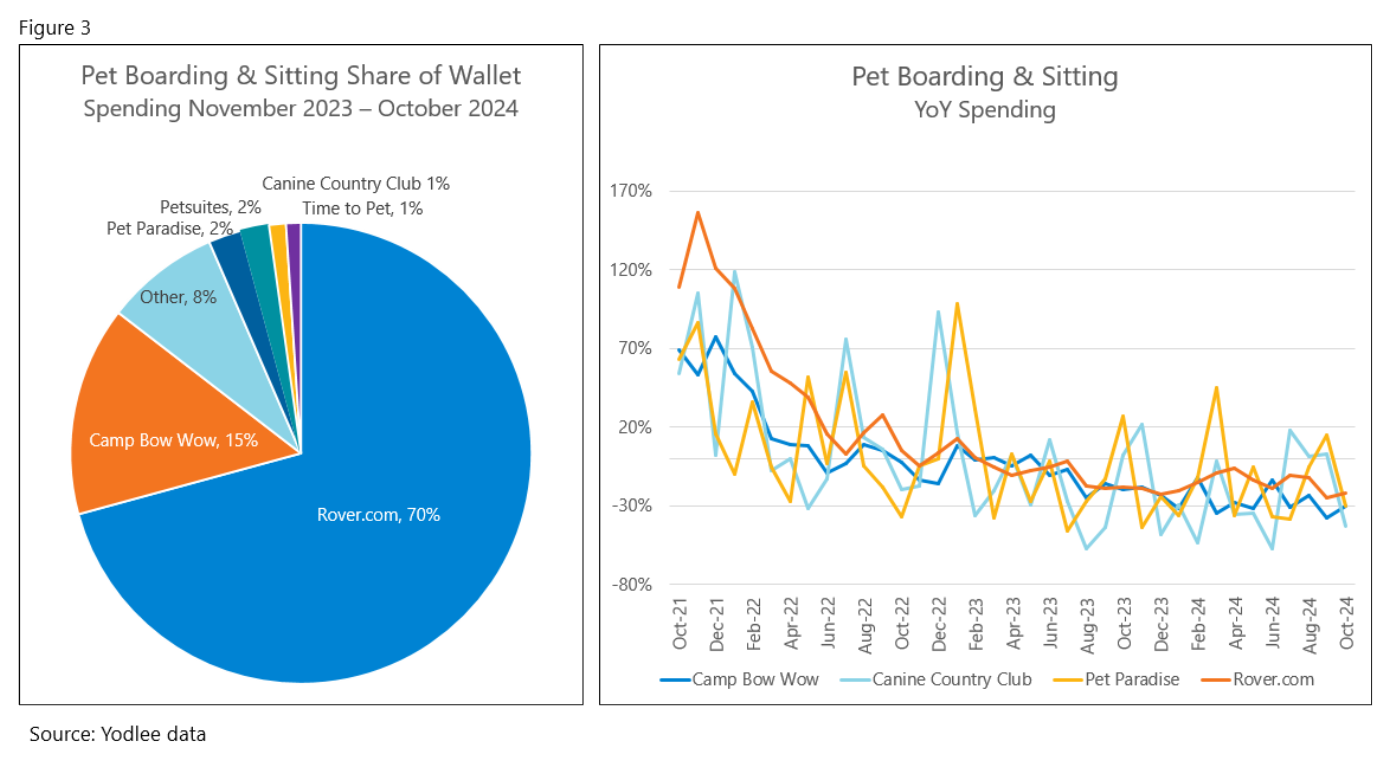
For the period of November 2023 through October 2024, Rover.com appears to dominate share of wallet compared to the other brands analyzed at 70% with average YoY growth relatively steady among its peers (Figure 3). Camp Bow Wow holds 15% wallet share and the data seems to track with periodic surges and apparent stabilizing.
Pet Care and Insurance: Investing in Pet Well-Being

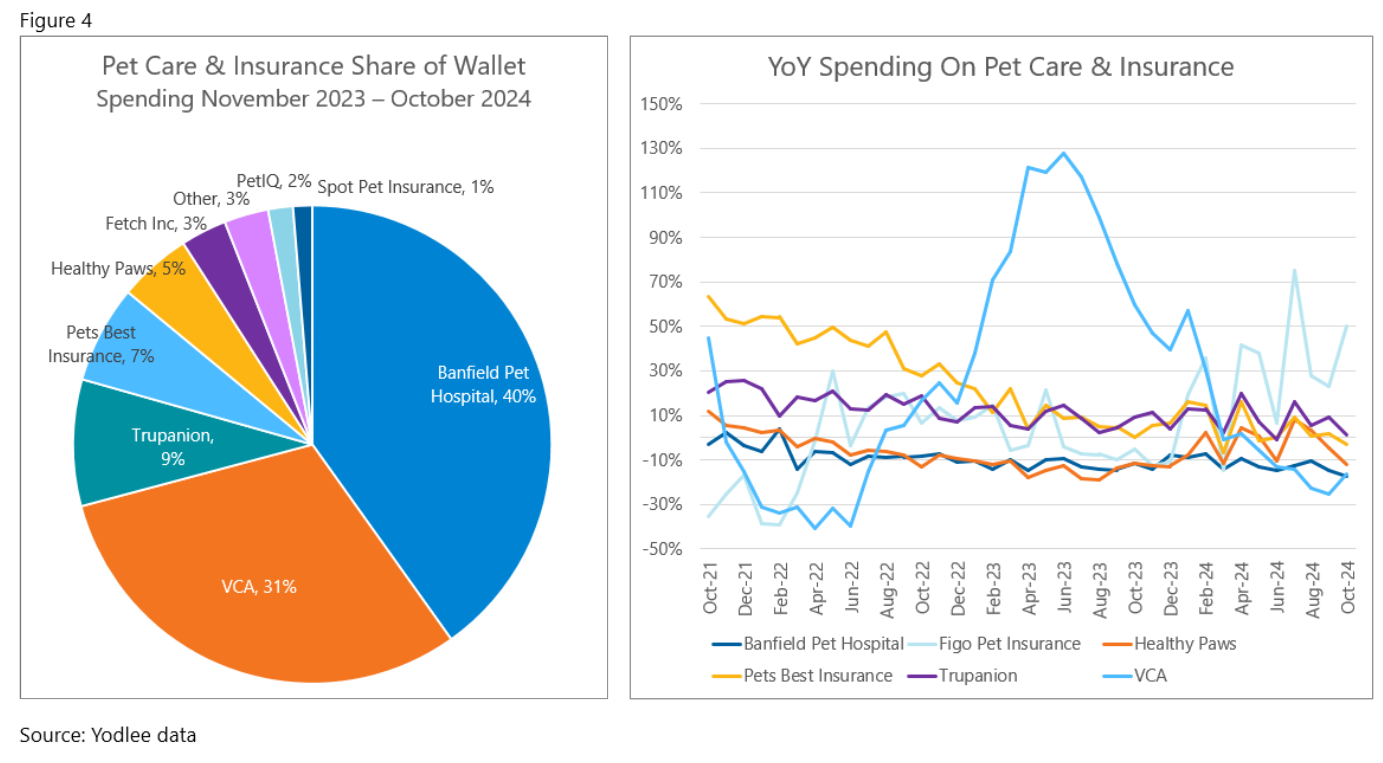
The US pet care and insurance category appears concentrated on two key brands with Banfield Pet Hospital and VCA together capturing a total of 71% share of wallet (see Figure 4). YoY spending trends appear to differ with Banfield holding mostly steady with periodic variations and VCA data suggesting higher spikes and lower dips.
Paws and Reflect: Pet Spending Key Takeaways
The US pet industry showcases distinct spending patterns across its key categories. Pet supplies dominate with the largest wallet share and steady growth, led by Chewy. Pet sitting and boarding appears to also have a big dog in wallet share, Rover.com, yet YoY spending trends across brands appear to follow a similar trajectory. Pet care and insurance suggests a mix of leaders such as Banfield and VCA while insurance providers like Trupanion and Pets Best seem to carve out meaningful but smaller niches.
These trends reveal how pet owners balance spending – whether it's food and supplies, sitting and boarding services, or investments in pet health – the numbers suggest a multifaceted industry that continues to evolve.
Want to see how transaction data can inform your investment process?
Learn more about Envestnet | Yodlee Merchant and Retail Insights and get a free demo from a sales representative.
About Envestnet | Yodlee Merchant, Retail, Shopper, and Spend Insights
Envestnet | Yodlee Merchant, Retail, Shopper, and Spend Insights utilize de-identified transaction data from a diverse and dynamic set of data from millions of accounts to identify patterns and context to inform spending and income trends. The trends reflect analysis and insights from the Envestnet | Yodlee data analysis team. By combining data with intelligence – connecting vast amounts of actual de-identified shopping data with state-of-the-art analytics and machine learning – Envestnet | Yodlee provides visibility into a large set of shopping daily purchase behavior including, but not limited to, transactions, customer lifetime values, and merchant/retailer shares.


