The fantasy sports and online gaming industry has seen sustained spending growth over the past few years, though recent data suggests the pace of that growth has begun to slow. As most states have now legalized these activities, the initial surge in consumer interest is stabilizing, signaling a maturing market. Even with this shift, the sector continues to attract significant spending.
Using deidentified consumer transaction data aggregated by Envestnet® | Yodlee®, we analyzed consumer spending patterns across a range of daily fantasy sports platforms. This de-identified data, sourced from millions of credit and debit card transactions, offers a unique glimpse into how users are engaging with leading companies such as DraftKings (DKNG) and FanDuel (FLUT), which collectively account for the majority of spending in this sector. Our analysis also includes insights into emerging competitors like BetMGM and PrizePicks, providing a comprehensive look at the evolving market landscape. By examining factors such as overall spend, user loyalty, and market share, we offer valuable insights for investors seeking to understand the dynamics of this rapidly maturing industry.
Fantasy Sports Surge Slows as Market Matures
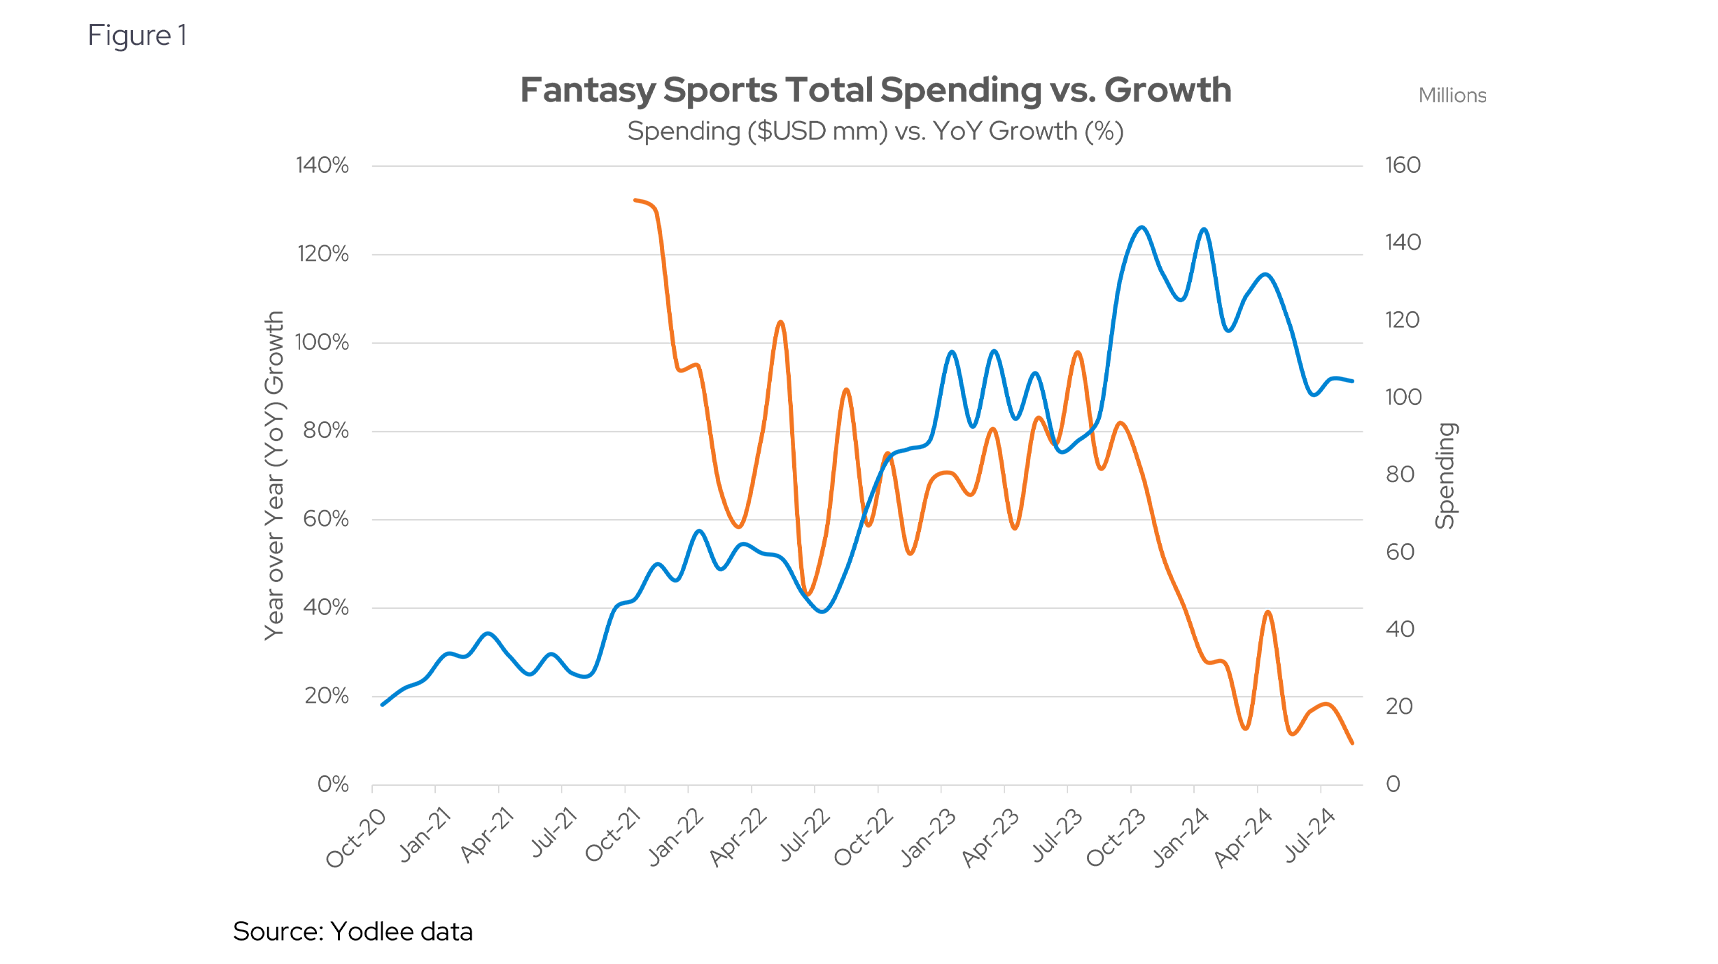
The online gaming sector has enjoyed robust growth in spending over the past two years as fantasy sports attracted more customers across the country, focusing on popular US sports such as football, baseball, and basketball.
While growth is still positive for the sector (blue line, Figure 1), the rate of growth has slowed considerably from 80% year-over-year (YoY) in the Fall of 2023 to just around 10% YoY in August 2024 (orange line, Figure 1). Part of this is potentially driven by the saturation of state legalizations, a major source of growth in prior years. According to the American Gaming Association, as of mid-2024, 38 states and the district of Columbia have legalized online gaming, while two states have active legislation/ballot initiatives. This shift highlights the industry’s move from rapid expansion to a more steady and mature phase of growth.
How the NFL Drives Fantasy Sports Growth
While the overall market for fantasy sports may be showing signs of maturing, the start of the NFL season continues to offer significant growth opportunities. The National Football League (NFL) remains the biggest driver of daily fantasy sports and online gaming in the US, with its strong hold on fan engagement. Each year, the league’s kickoff brings an influx of activity, as fans flock to platforms to participate in fantasy leagues and contests.
To further boost excitement, the NFL has expanded the number of primetime games in its opening week, catering to its media partners like Amazon and NBC’s Peacock streaming platform. These additional games, combined with the league's strategic partnership with AWS for sports analytics, help fuel consumer activity on daily fantasy platforms.
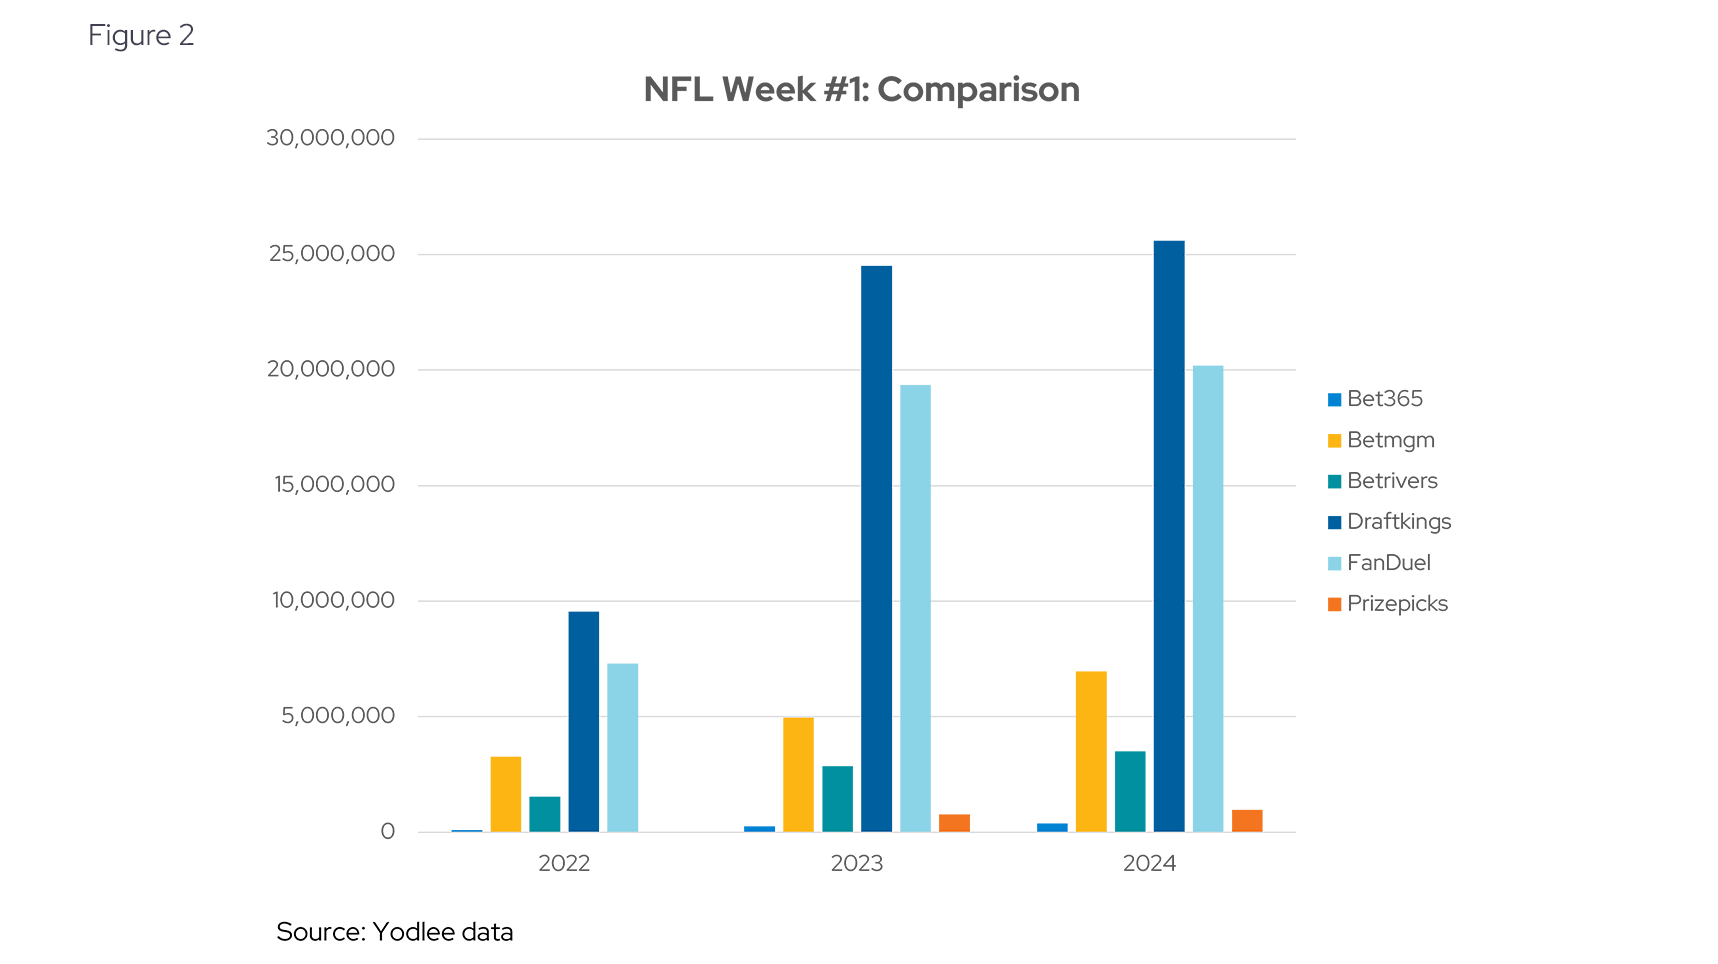
Looking at the data in Figure 2, the NFL’s opening week generated a surge in activity between 2022 and 2023, with a remarkable 142% growth. However, this momentum has tapered in 2024, with a more moderate increase of 9.3%, despite the increase in primetime games from three to four. This suggests that while the NFL remains a powerful catalyst for growth, the market may be reaching a point of stabilization.
Shifting Market Dynamics in Fantasy Sports
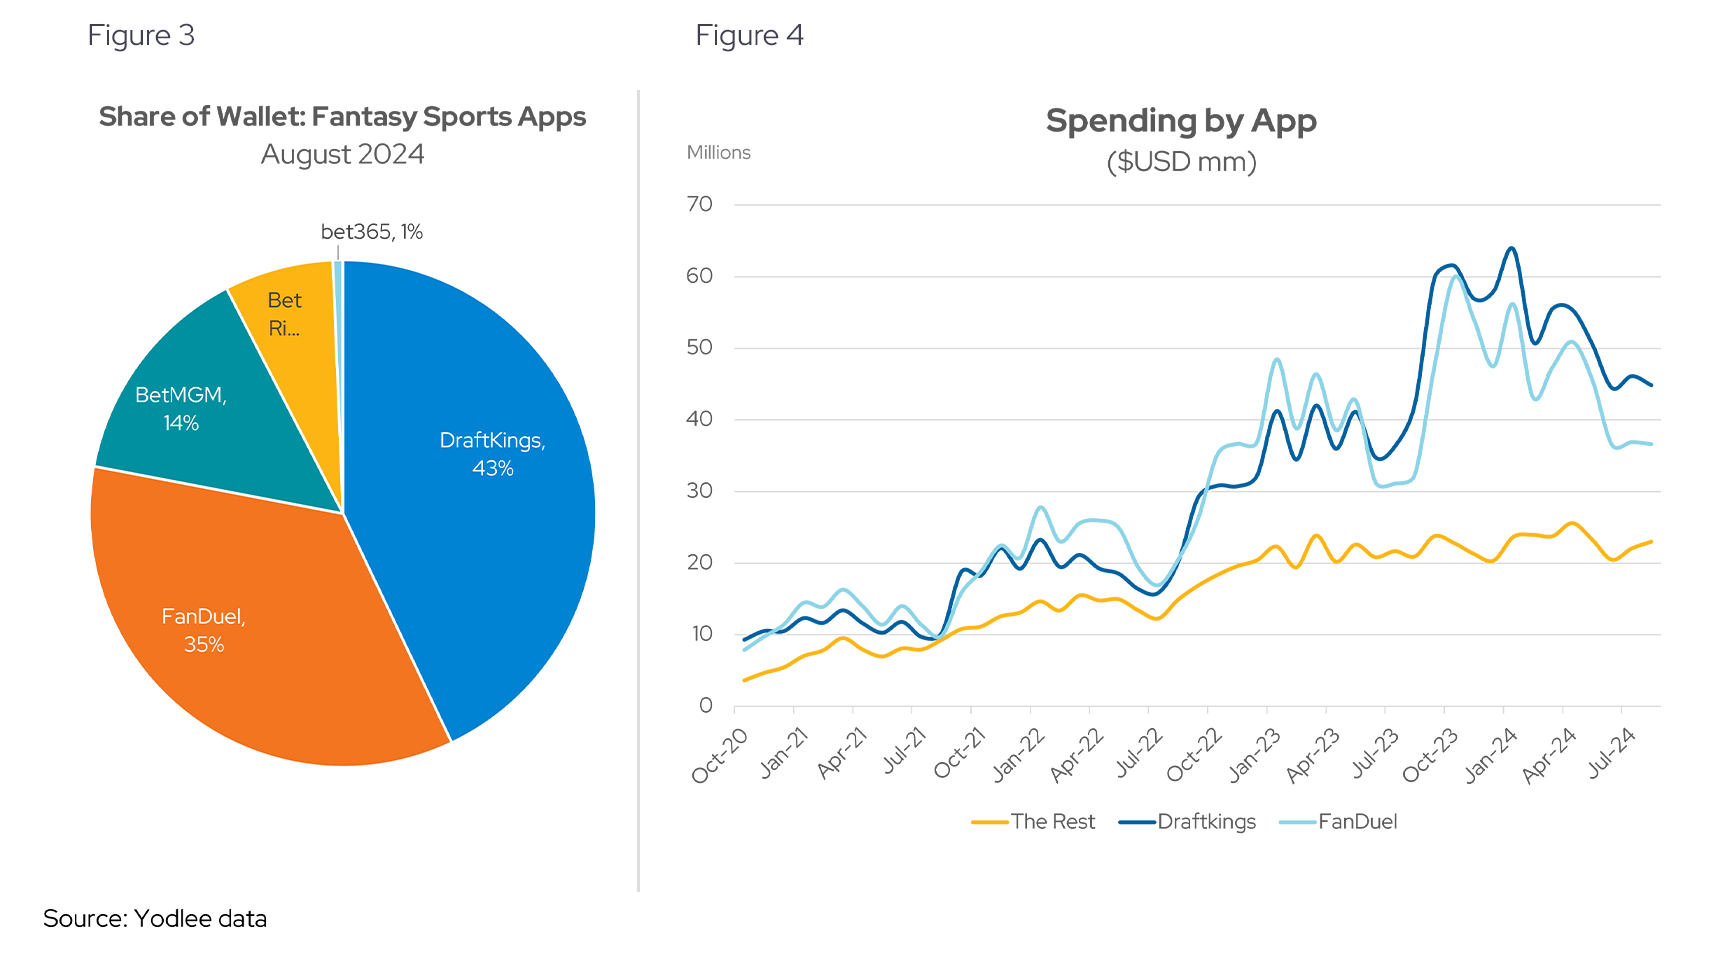
As of August 2024, DraftKings (DKNG US) and FanDuel (FLUT US) continue to command the majority of consumer spending in the fantasy sports space, capturing 78% of the total share (see Figure 3). Yodlee data suggests that DraftKings holds a slight edge in market share, maintaining its position as the industry leader. Both companies have leveraged their early entry into daily fantasy sports to solidify their dominance, making them the go-to platforms for consumers.
However, new players like BetMGM and PrizePicks have started to carve out their own space. These emerging competitors, supported by significant capital, have managed to capture a small but growing portion of the market. Heading into the current football season, these upstarts have made notable gains, though their overall spending levels have remained relatively stable since early 2023 (see Figure 4). The recent uptick in their market share will be important for investors to monitor as the industry continues to evolve.
FanDuel vs. DraftKings: The Battle for Market Share
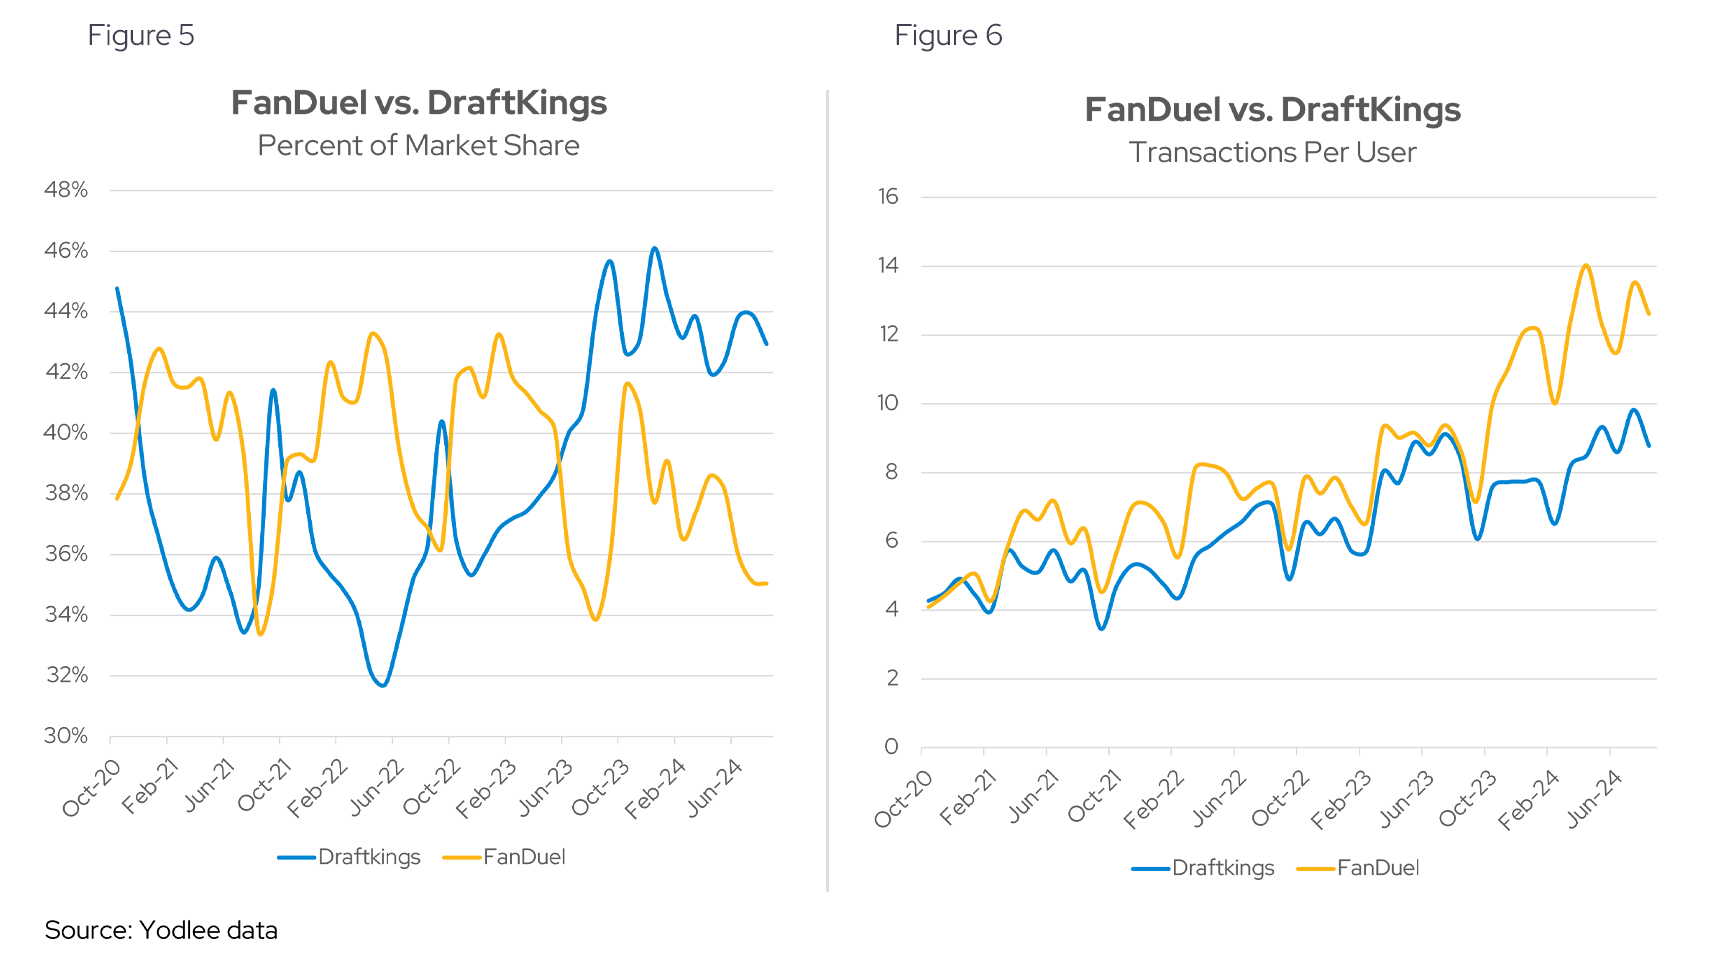
While the broader fantasy sports market has seen increased competition, FanDuel and DraftKings continue to dominate. These two major players have been locked in a contest for market share over the past few years (see Figure 5), each vying to capture more of the growing user base. As they compete, both companies have shifted their strategies to focus on increasing revenue per user, a key driver of growth in this maturing industry.
A major part of this strategy revolves around gamification and novelty features, with parlays emerging as a significant source of engagement and profitability for both platforms. These features appear to be contributing to a rise in the number of transactions per user, as consumers are drawn to the dynamic, interactive nature of daily fantasy sports (see Figure 6). By continuing to innovate and enhance the user experience, FanDuel and DraftKings are positioning themselves to maintain their lead in this evolving market.
Loyalty and Engagement Across Platforms
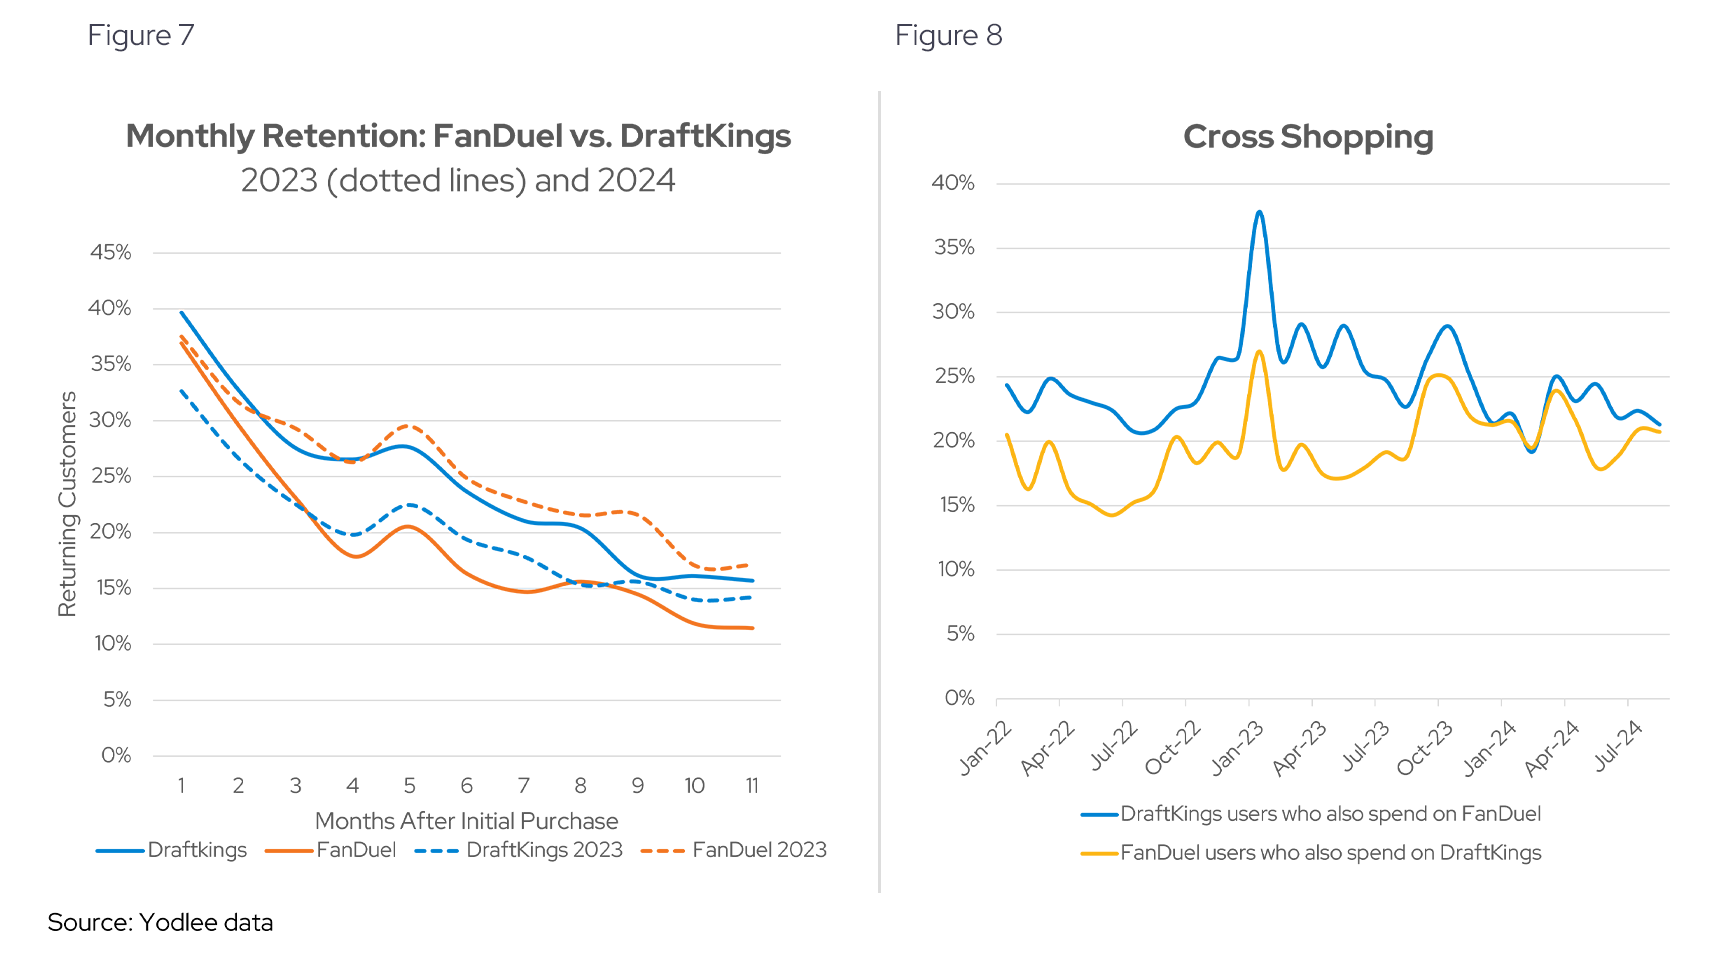
As DraftKings and FanDuel continue to compete for market share, user retention has become a critical measure of success. Both platforms boast strong retention rates, with around 40% of their customers returning to spend again after the first month. However, like most subscription-based services, these numbers decline over time, with retention dropping to just under 20% after a year (see Figure 7).
At the six-month mark, DraftKings has pulled ahead, retaining 24% of its users compared to 16% for FanDuel (see Figure 7). This improvement in retention for DraftKings, coupled with FanDuel’s slight decline, marks a shift from the previous year’s trends. It’s possible that changes in promotional strategies, such as a reduction in subsidies or FanDuel’s efforts to limit professional players, are contributing to these differences. While the exact reasons behind the divergence are unclear, this evolving dynamic between the two platforms will be important to track.
Retention isn’t the only metric that reveals competition between these two giants. Cross-shopping between the two services remains notable. Yodlee data suggests that DraftKings users are just as likely to spend with FanDuel, and vice versa. Although FanDuel previously had a more loyal customer base in 2022, that gap has largely closed, with roughly 20% of customers for each platform now engaging with both services (see Figure 8).
DraftKings vs. FanDuel: Looking at Statistics Side by Side
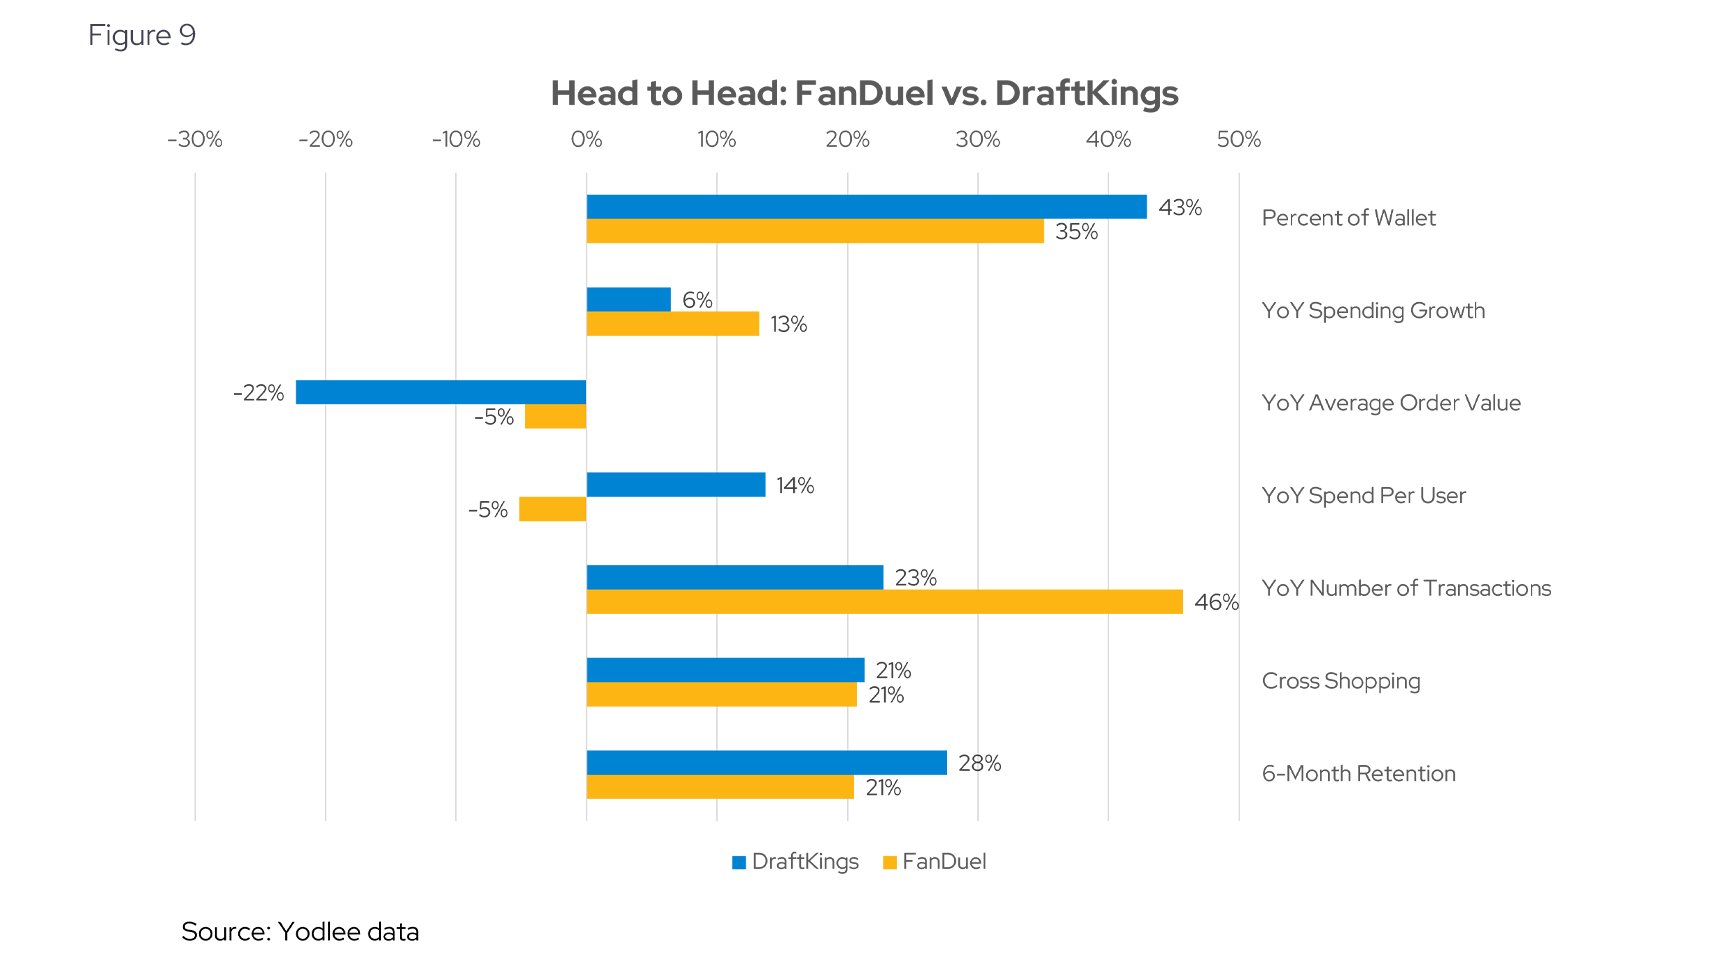
Which company appears to be better positioned for the future? We believe the companies show differing strengths. While FanDuel has been growing a little faster according to our data (13% vs 6% YoY, see Figure 9), DraftKings appears to exhibit stronger user retention and per user spend. FanDuel has also been able to increase the number of transaction by 46%, compared to only 23% for DraftKings (see Figure 9).
Navigating the Evolving Fantasy Sports Market
Daily fantasy sports services remain a very dynamic and fertile space for investors to analyze. There is an interaction of adoption trends across states, competition, saturation, steady-state growth, as well as the impact of different gamified aspects of the platforms. Gaining granular insight into these developing spending patterns can help investors stay informed and ahead of the trend.
Want to see how transaction data can inform your investment process?
Learn more about Envestnet | Yodlee Merchant and Retail Insights and get a free demo from a sales representative.
About Envestnet | Yodlee Merchant, Retail, Shopper, and Spend Insights
Envestnet | Yodlee Merchant, Retail, Shopper, and Spend Insights utilize de-identified transaction data from a diverse and dynamic set of data from millions of accounts to identify patterns and context to inform spending and income trends. The trends reflect analysis and insights from the Envestnet | Yodlee data analysis team. By combining data with intelligence – connecting vast amounts of actual de-identified shopping data with state-of-the-art analytics and machine learning – Envestnet | Yodlee provides visibility into a large set of shopping daily purchase behavior including, but not limited to, transactions, customer lifetime values, and merchant/retailer shares.