In our latest analysis of athleisure in the sportswear industry, we explore how this fast-growing sector has evolved, driven by the convergence of comfort, style, and a shift to hybrid work. In this deep dive, we focus on several leading athleisure brands, including Nike (NKE), Adidas (ADDYY), Lululemon (LULU), and Under Armour (UAA) to provide a view of how these companies are capturing and retaining consumer attention.
Leveraging de-identified transaction data from Envestnet® | Yodlee®, we offer an in-depth look at spending patterns, average spend per transaction, and income demographics starting from January 2020. Our analysis sheds light on the changing dynamics of this category, such as shifts in consumer income brackets to the growth in digital sales channels, helping brands refine their strategies and adapt to ever-evolving consumer demand.
The Power Players Shaping the Athleisure Industry
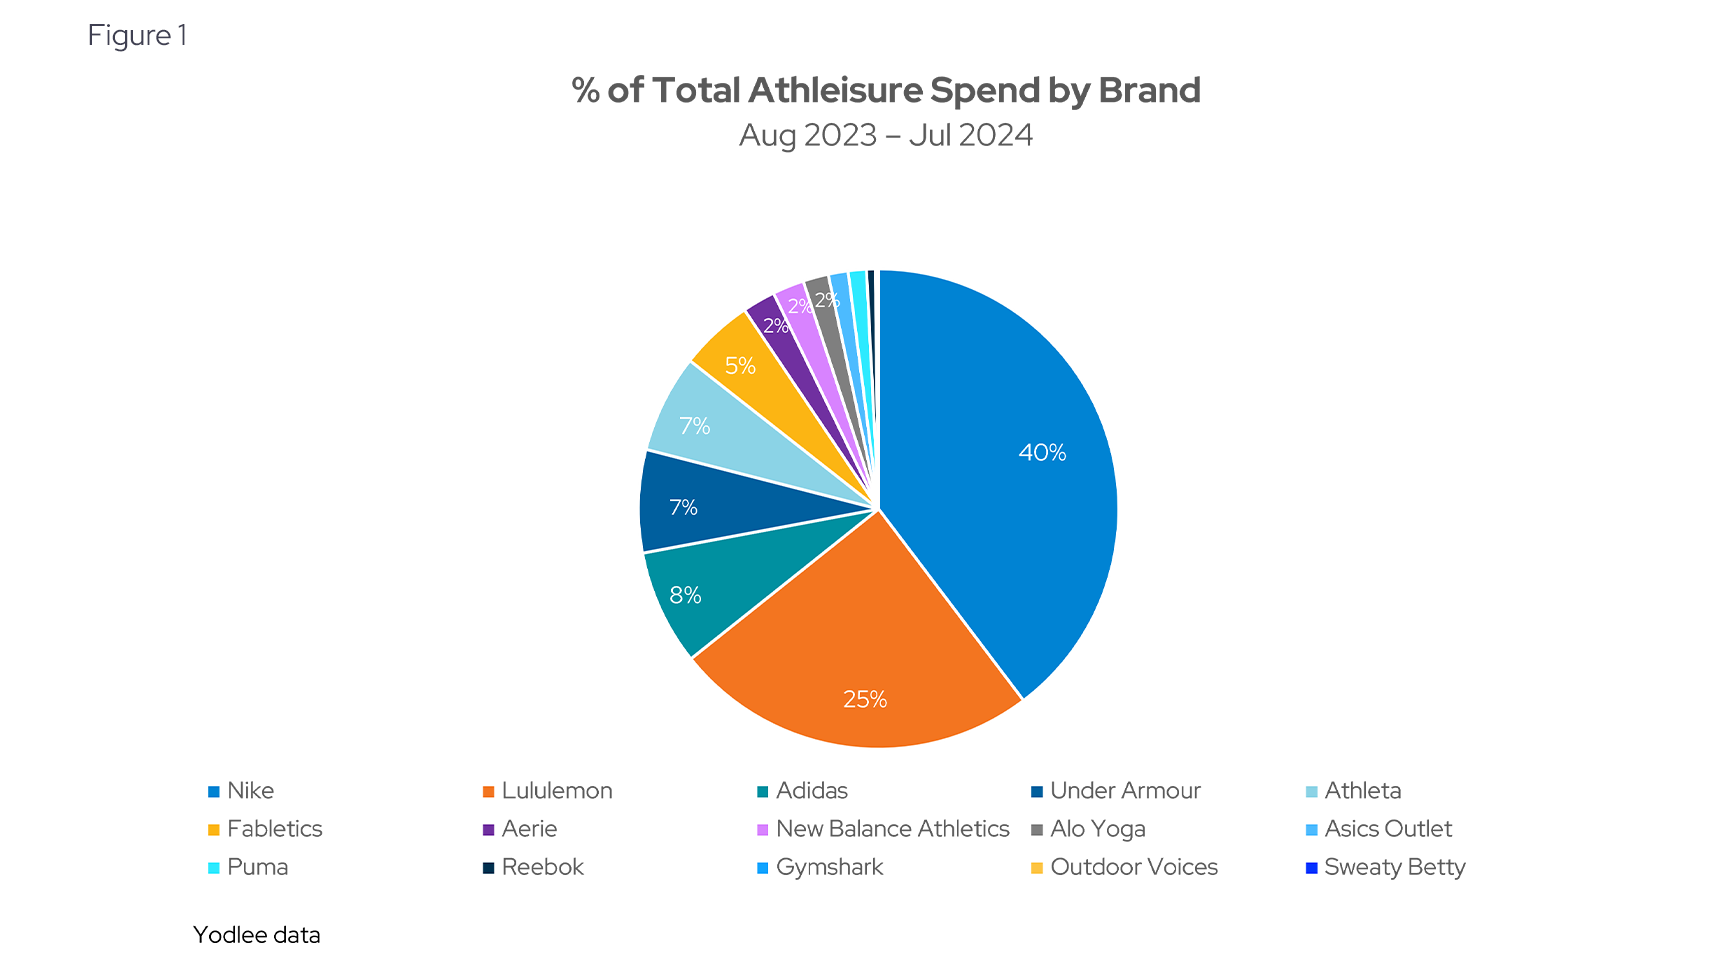
Analyzing the percent of total athleisure spend across 15 brands between August 2023 to July 2024, Yodlee data included the greatest spend at Nike and Lululemon, as well as Adidas and Under Armour representing smaller shares compared to the top two (see Figure 1).
This is consistent with a report from Athletic Brands that says Nike's market share in athletic wear is significant, accounting for approximately 27% of the global sports apparel market. The brand's strong market position is a result of its continuous innovation, brand recognition, and strategic partnerships with athletes and sports teams. The report goes on to say that other key players in the athletic apparel market include Adidas, Puma, Lululemon Athletica, Under Armour, and Columbia Sportswear.
Comfort is Still In as Athleisure Spending Continues to Rise
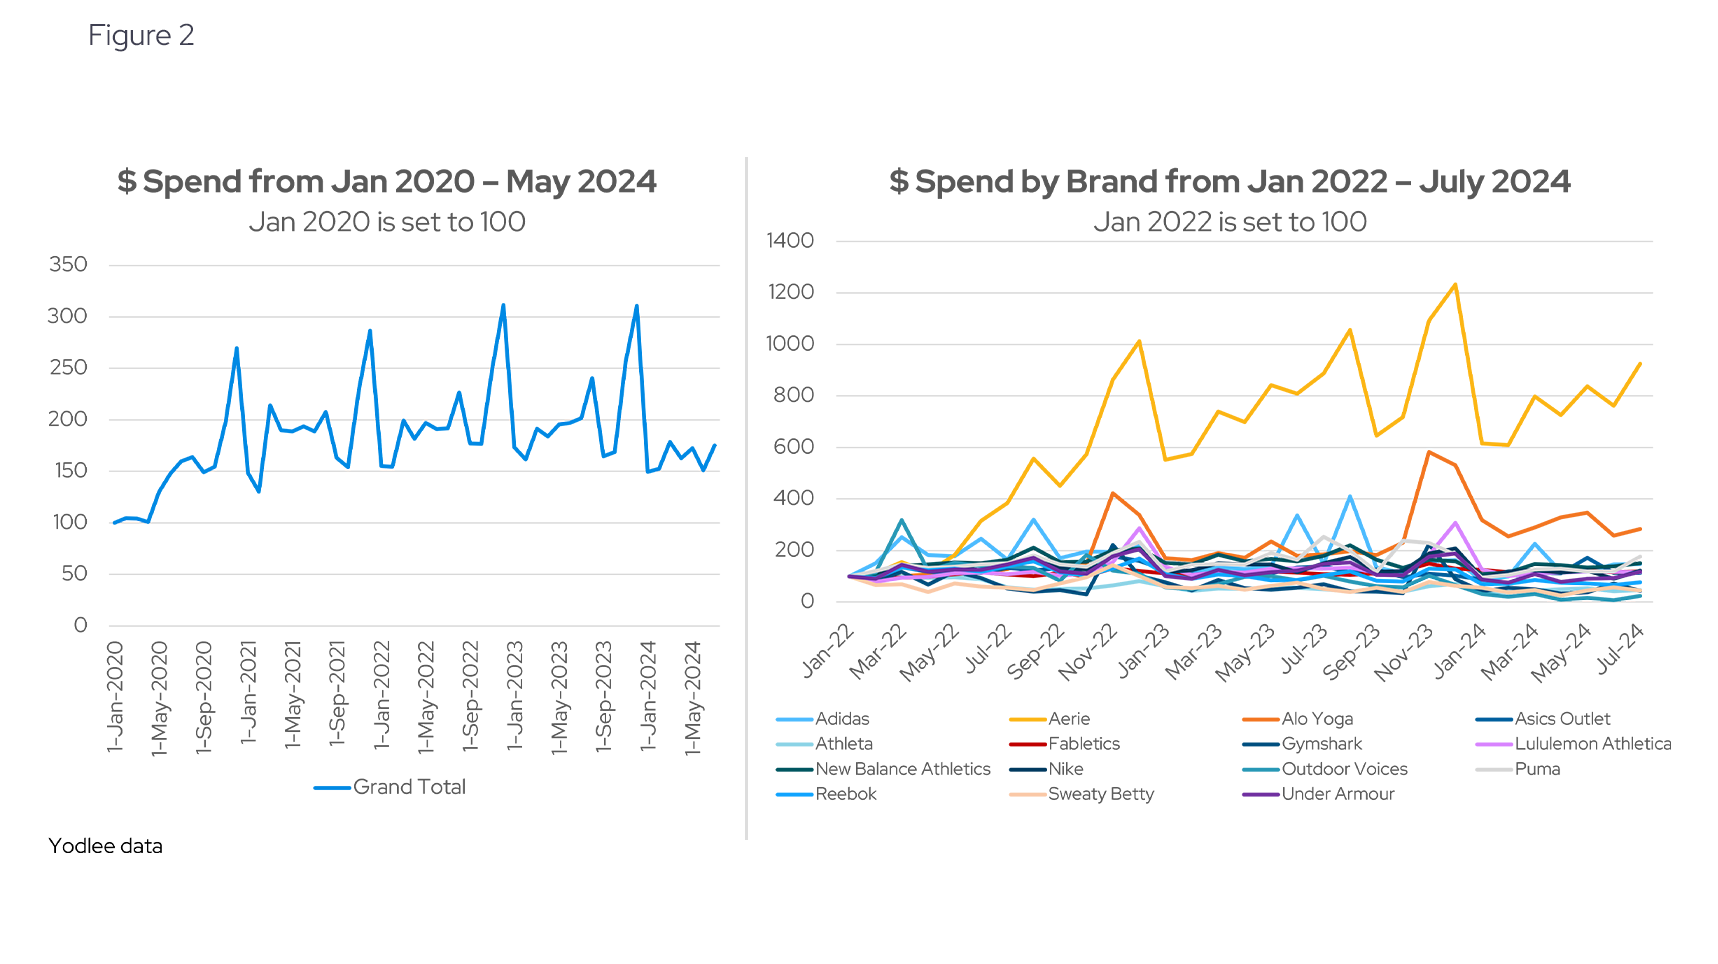
Overall spending in the athleisure sector has evolved over time, with notable fluctuations between January 2020 and May 2024. Following the initial surge during the pandemic, when consumers shifted towards comfort-focused apparel, spending saw a brief decline. However, relative to pre-pandemic spending, levels have remained consistently higher, indicating the sustained appeal of athleisure as a key category for consumers (see Figure 2).
According to a report from Grandview Research, the global athleisure market size was estimated at $358.07 billion in 2023 and is projected to grow at a CAGR of 9.3% from 2024 to 2030. The growing enthusiasm for sports and outdoor recreational activities among the young population is expected to drive up the demand for athleisure. A key factor contributing to this trend is the increasing awareness of fitness and health, which is boosting the need for comfortable and stylish clothing.
From January 2022 to July 2024 (see Figure 2), Nike, Lululemon, and Adidas have consistently captured significant portions of consumer spending, reinforcing their strong market presence. Meanwhile, brands like Aerie and Alo Yoga have shown increasing levels of consumer spend, suggesting growing interest in these emerging brands.
Athleisure User Distribution: Leaders and Emerging Contenders
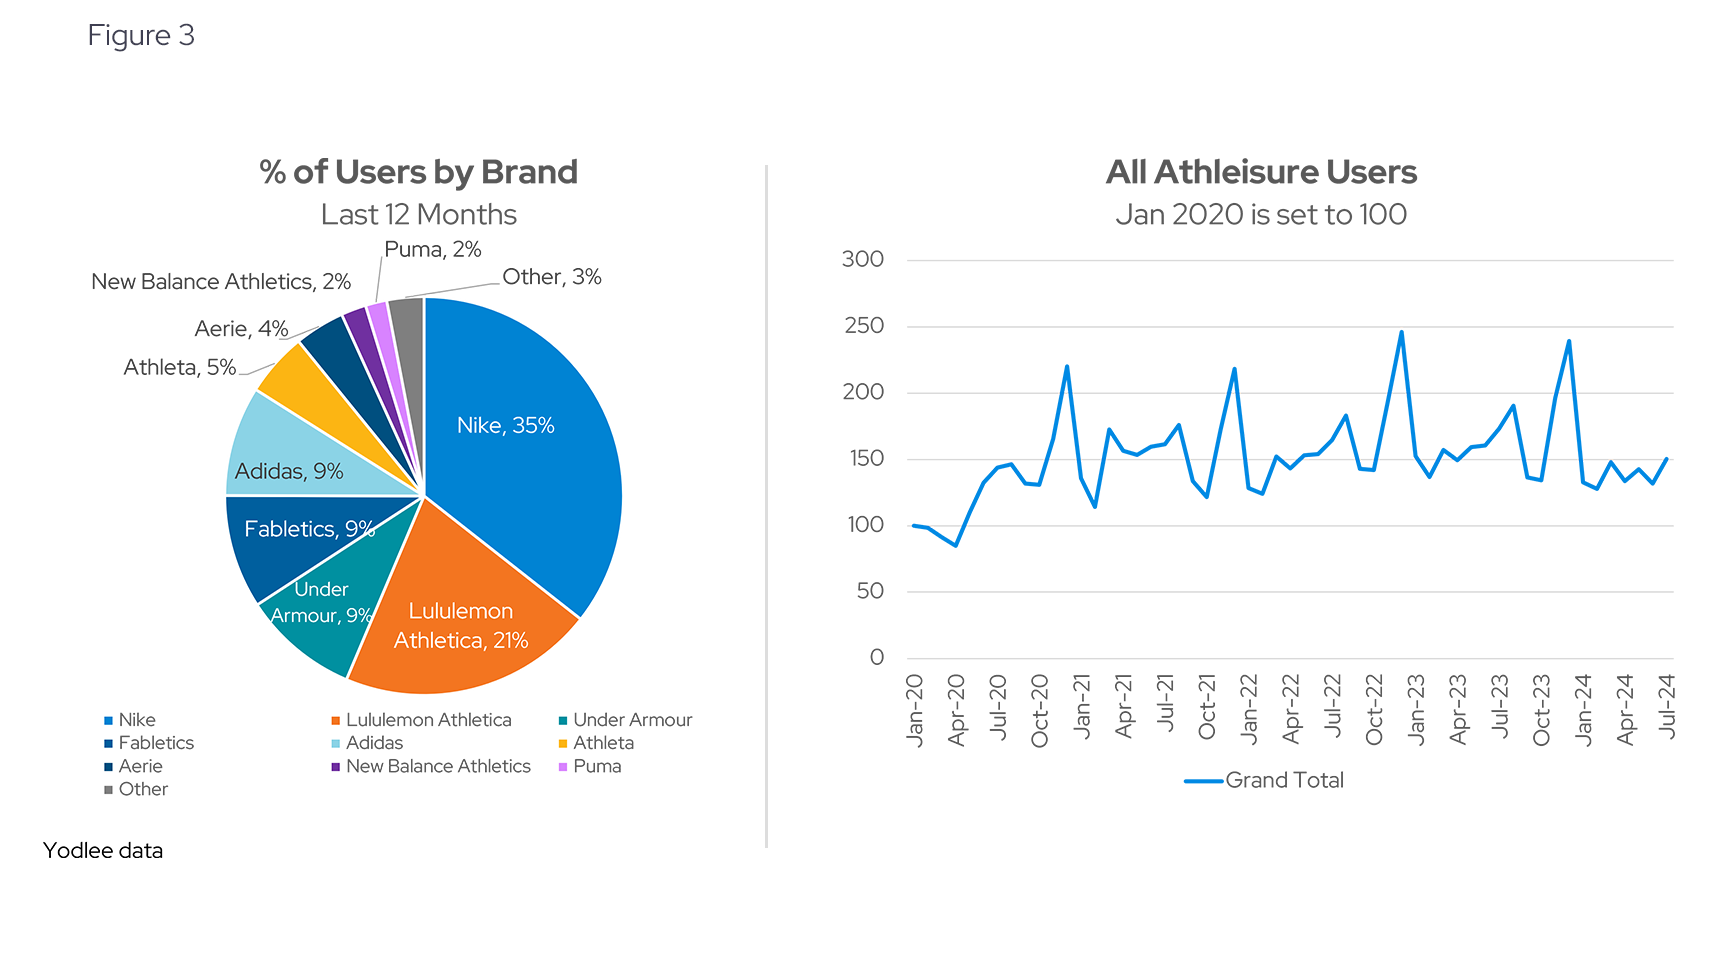
The distribution of users among athleisure brands reveals interesting patterns about consumer preferences. Yodlee data suggests that Nike leads in attracting the largest share of users, followed by Adidas and Lululemon. These brands consistently engage a broad user base, indicating their wide appeal across various demographics (see Figure 3).
Yodlee data also highlights overall user growth and how different brands are expanding their customer bases. Smaller brands like Athleta and Aerie, while having a smaller overall user share, have seen steady growth in their user numbers, suggesting they are gaining traction in niche markets. This data underscores the competitive nature of the athleisure sector, where both established and emerging brands are carving out loyal user bases (see Figure 3).
Exploring the Income Diversity of Athleisure Shoppers
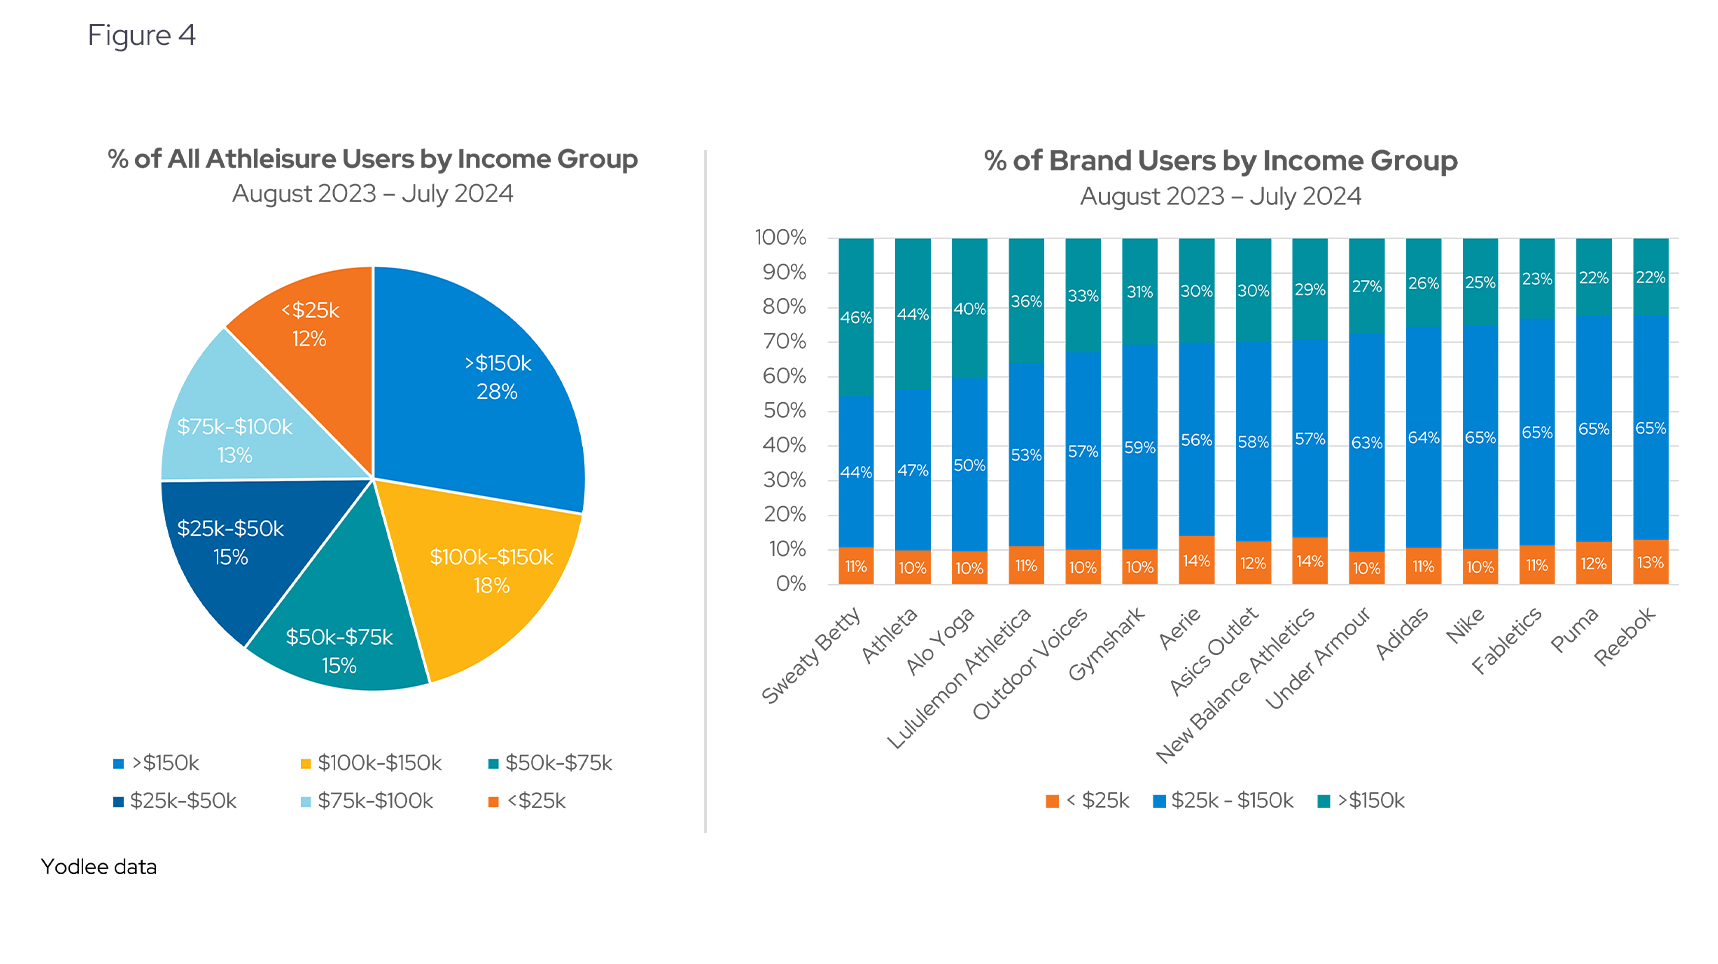
Yodlee data reveals that high-income consumers (earning $150k or more) make up 28% of athleisure buyers. Interestingly, lower-income users (earning $50k or less) account for 40% of the market, indicating that athleisure has a broad appeal across various income groups (see Figure 4).
The data suggests that premium brands like Sweaty Betty and Athleta tend to attract more high-income consumers, while brands such as Nike and Adidas attract more middle-income users. Notably, lower-income users are fairly evenly spread across all brands, indicating that they engage with a variety of athleisure options rather than being concentrated with a single brand (see Figure 4).
The Rise and Fall of Digital Sales in Athleisure
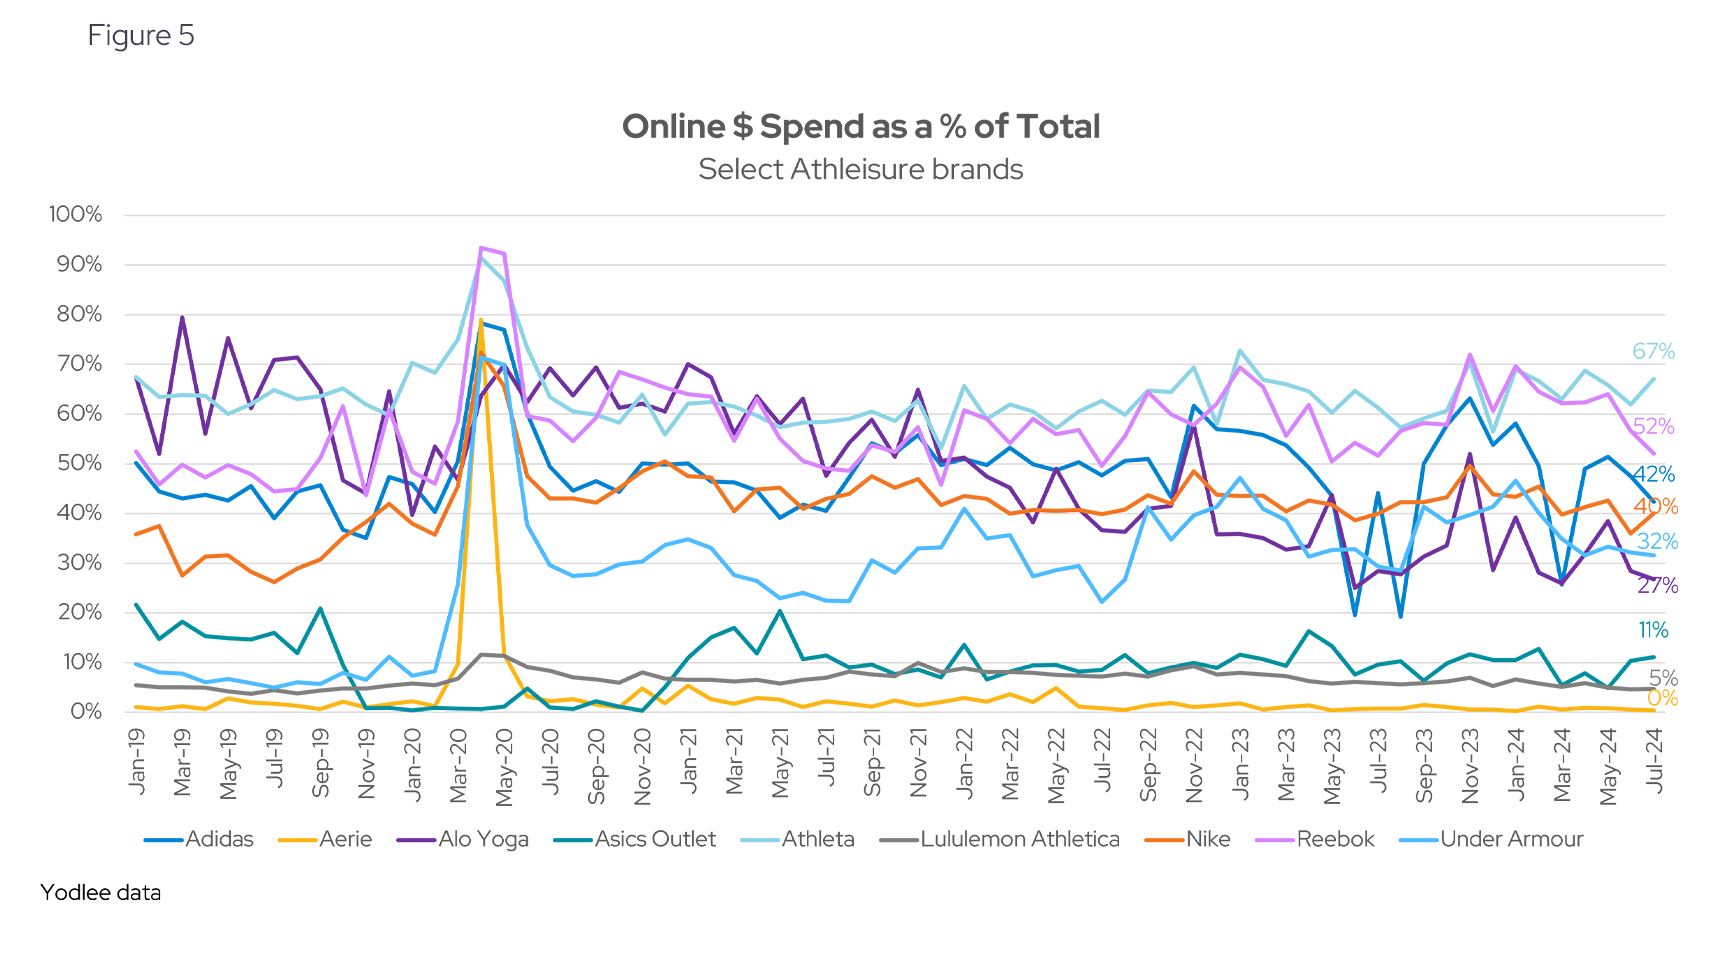
Digital sales have played a significant role in the athleisure industry, with some brands consistently leveraging e-commerce platforms. Yodlee data indicates that Athleta and Reebok have maintained a strong and steady presence in digital sales, indicating their reliance on online channels as a significant part of their revenue (see Figure 5).
The data also shows an expected spike in digital sales during the height of the pandemic, reflecting the surge in online shopping as consumers shifted away from physical stores. However, the post-pandemic period has seen a rebound in in-store shopping, with some brands, like Alo Yoga, showing a downward trajectory in their digital sales as consumers return to physical retail (see Figure 5).
A report from Fact View Research says that despite pandemic-related challenges, the athleisure market showcased resilience, with e-commerce emerging as a crucial channel for retail sales. Brands with a strong online presence or those quick to adapt to digital platforms witnessed growth. The pandemic also prompted a reevaluation of brand strategies, leading to innovations in marketing and product offerings to align with evolving consumer behaviors.
Athleisure’s Continued Rise
This analysis provides a multi-faceted view of the athleisure market, offering insights into brand performance, consumer preferences, market dynamics, and engagement trends. By examining key data across spending, income demographics, digital sales, and customer retention, we gain a more holistic understanding of how this competitive landscape is evolving.
Loyalty continues to play a significant role in shaping the market, with brands working to maintain strong connections with their customer bases. The growing importance of digital sales highlights how crucial it is for brands to adapt to the shifting preferences of online shoppers, even as in-store shopping rebounds. Additionally, income distribution offers valuable insights into how different consumer groups engage with various brands, shaping how the market evolves moving forward. As the athleisure sector adapts, brands that effectively balance these factors will be better positioned to thrive in this competitive environment.
Want to get ahead of transaction trends?
Subscribe to our research data blog for ongoing updates or reach out for a personalized, up-to-date view of Yodlee deidentified spending data.
About Envestnet | Yodlee Merchant, Retail, Shopper, and Spend Insights
Envestnet | Yodlee Merchant, Retail, Shopper, and Spend Insights utilize de-identified transaction data from a diverse and dynamic set of data from millions of accounts to identify patterns and context to inform spending and income trends. The trends reflect analysis and insights from the Envestnet | Yodlee data analysis team. By combining data with intelligence – connecting vast amounts of actual de-identified shopping data with state-of-the-art analytics and machine learning – Envestnet | Yodlee provides visibility into a large set of shopping daily purchase behavior including, but not limited to, transactions, customer lifetime values, and merchant/retailer shares.
To learn more about Envestnet | Yodlee Merchant and Retail Insights and get a free demo, please contact an Envestnet | Yodlee sales representative.