In our latest analysis of the cruise industry, we explore how this pandemic-hammered sector has been performing, shaped by shifting consumer behaviors and a continued demand for travel. In this deep dive, we focus on the cruise industry’s leading brands, including Royal Caribbean (RCL), Carnival Cruise Line (CCL), Norwegian Cruise Lines (NCLH), and Viking Cruises, to gain deeper insights into how these companies are navigating this revived industry.
Leveraging the extensive de-identified transaction data from Envestnet® | Yodlee®, we provide a comprehensive look at cruise spending patterns, ticket costs, and user demographics trends from January 2020 through April 2024. Our analysis sheds light on the evolving strategies of these key players, from pricing adjustments to demographic targeting, as well as the broader market shifts that are redefining the cruise experience.
The cruise industry picks up speed post-pandemic
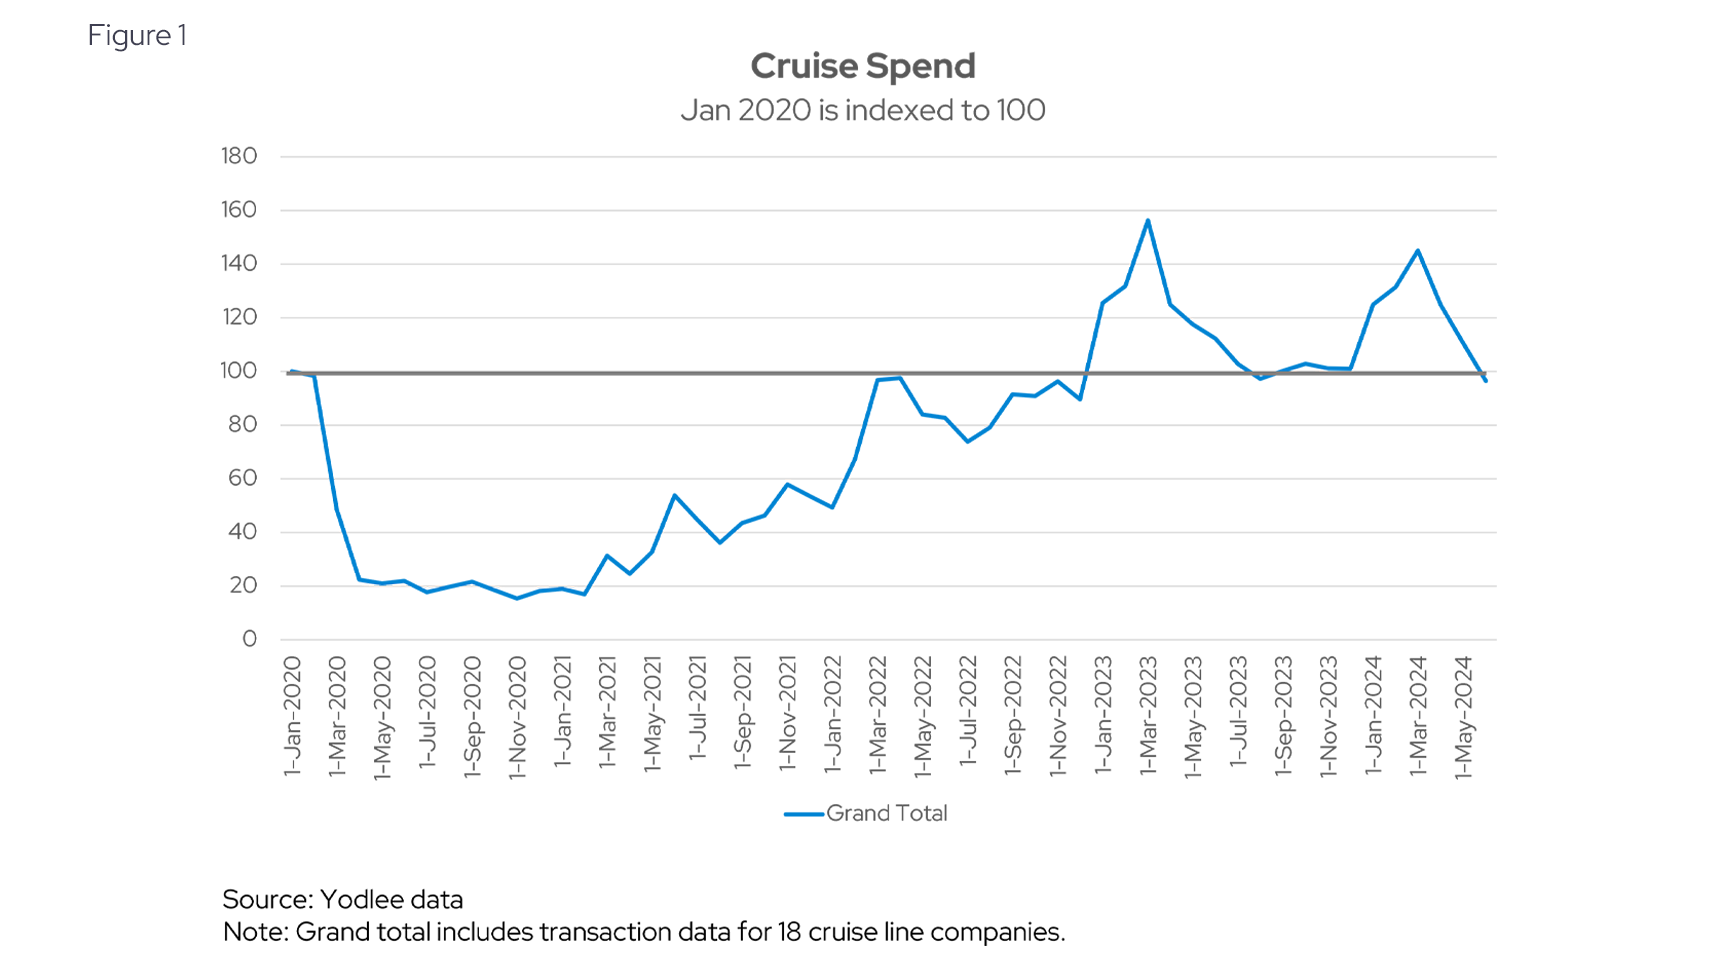
Yodlee data suggests that cruise spending, which saw a significant decline during the pandemic, rebounded since 2021 and even exceeded pre-pandemic levels (see Figure 1). As travel restrictions eased and consumers became more comfortable with being confined on ships, spending on cruises steadily increased, reflecting a pick-up in the industry. This data indicates that the resurgence in demand through May 2024. has not only brought the industry back to its feet but pushed spending to new heights, surpassing the figures seen before the pandemic. This is confirmed by a report from Cruise Lines International Association (CLIA) that said cruise travel reached 107% of 2019 levels in 2023—with 31.7 million passengers sailing.
In the same report, CLIA estimates about 36 million passengers are expected to take a cruise in 2024, 6% more than in 2019. Major cruise lines have enjoyed a successful 2024 season to date. As shown in Figure 1, the period from January to March 2024, when operators offer their best deals, there was a spike in spending.
Leading the fleet: Market giants drive cruise spending trends for US consumers
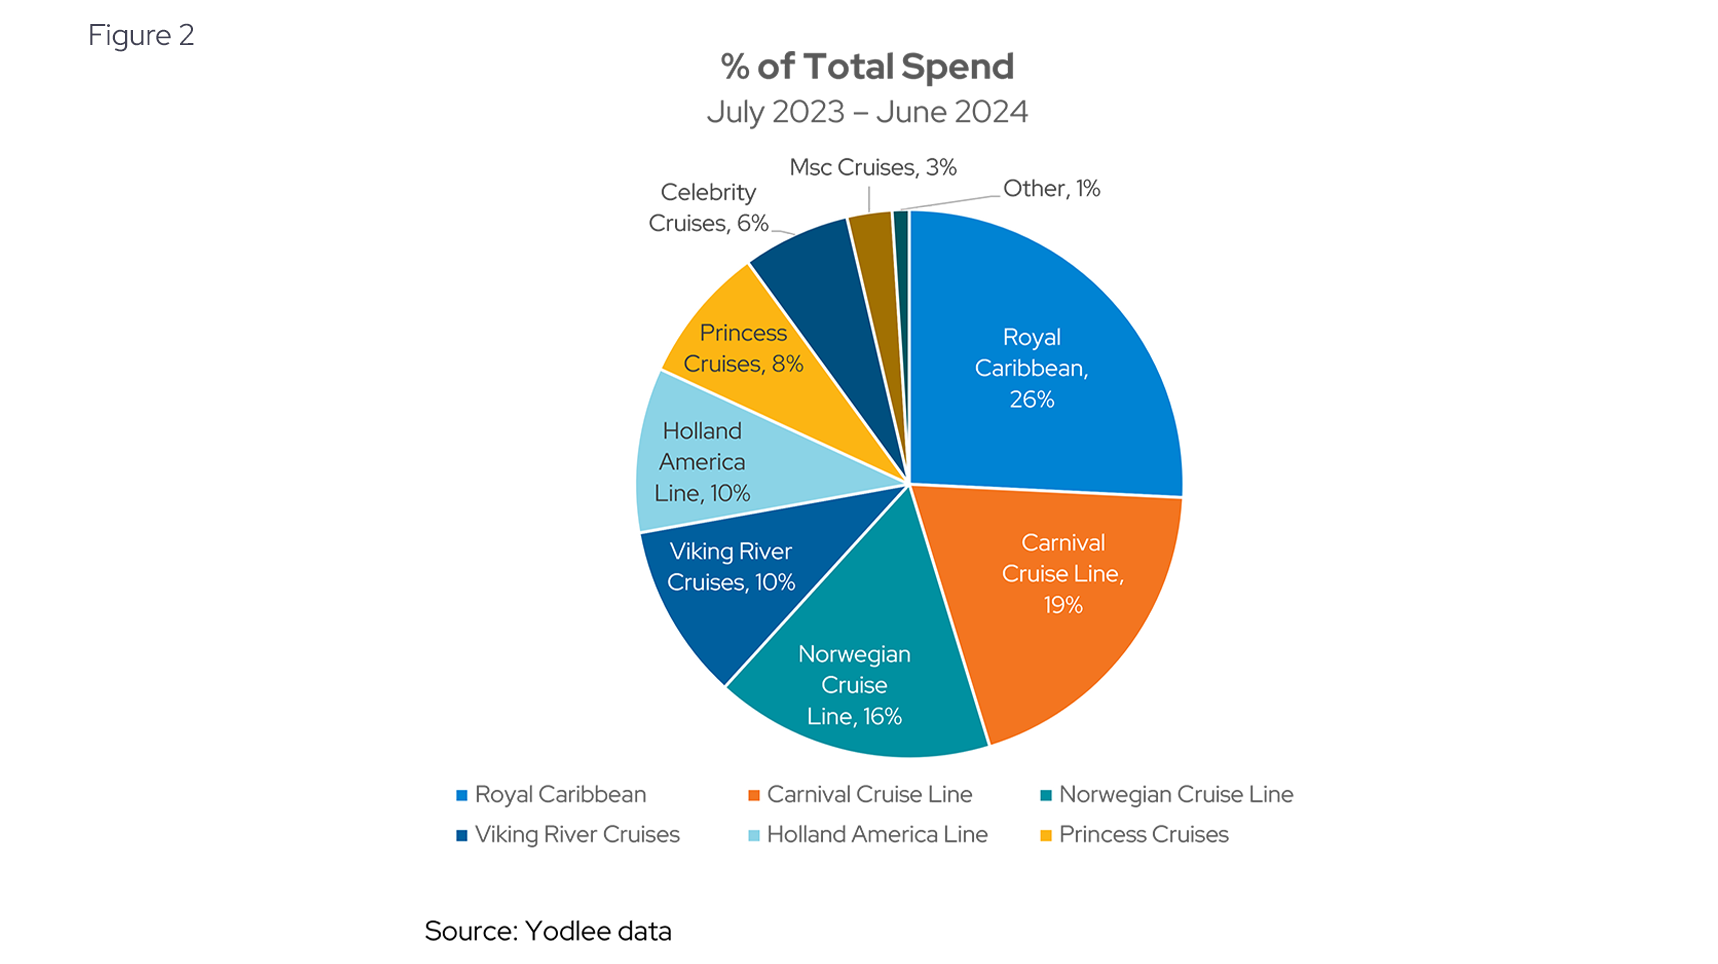
Looking more specifically at who benefited based on US spend, in Figure 2, Yodlee data suggests that during the period from July 2023 through June 2024, three cruise lines captured over 50% of the spend, Royal Caribbean, capturing 26% of the total spend over that period, Carnival Cruise Line, securing 19% of the spending, and Norwegian Cruise Lines captured 16%.
A report from Grandview Research indicates that the global cruise market is characterized by the presence of large, prominent key players and small local players. The majority of the market share is occupied by two companies, Carnival Corporation and Royal Caribbean Group. Companies are focused on new initiatives to increase their clientele. Such as multigenerational packages targeting family travel, kids theme cruise vacations for children, mystery theme cruise vacations, etc. These key players operating in the global market for cruise market are focusing particularly on expanding their business to the untapped region or countries.
Cruise ticket costs increase in a recovering market
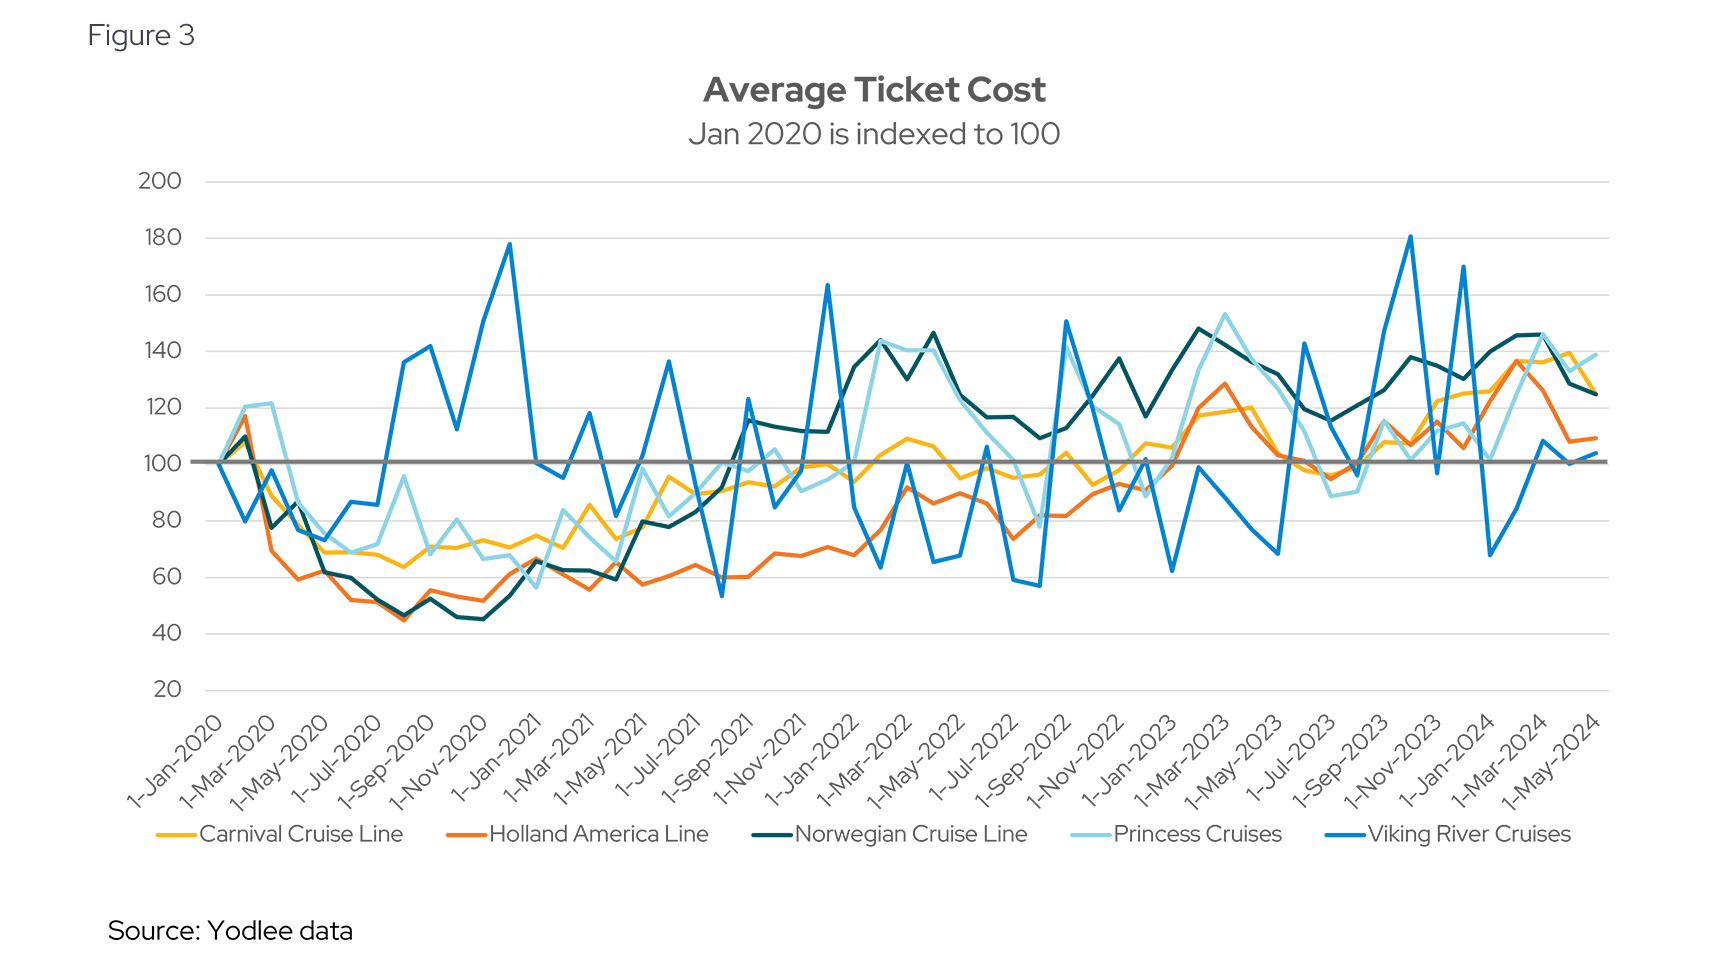
Yodlee data suggests that average ticket costs increased for many cruise lines over the period from January 2020 to May 2024 (see Figure 3), reflecting the industry's recovery and the growing demand for cruise vacations. This is confirmed by a Reuters report that said cruise operators have been raising prices with demand increases
Viking River Cruise operates in a niche segment, capturing only 2% of the market in terms of users (see Figure 5). According to Cruising Market, Viking is known for its luxurious and all-inclusive travel experiences, offering top-notch amenities, personalized service, and unique itineraries. Additionally, Viking's ticket pricing is the most volatile among cruise lines (see Figure 3), a trend likely tied to its market positioning, where prices fluctuate based on demand, exclusive offerings, and the unique experiences it provides.
Cruise users surge back, with Carnival and Royal Caribbean leading the way
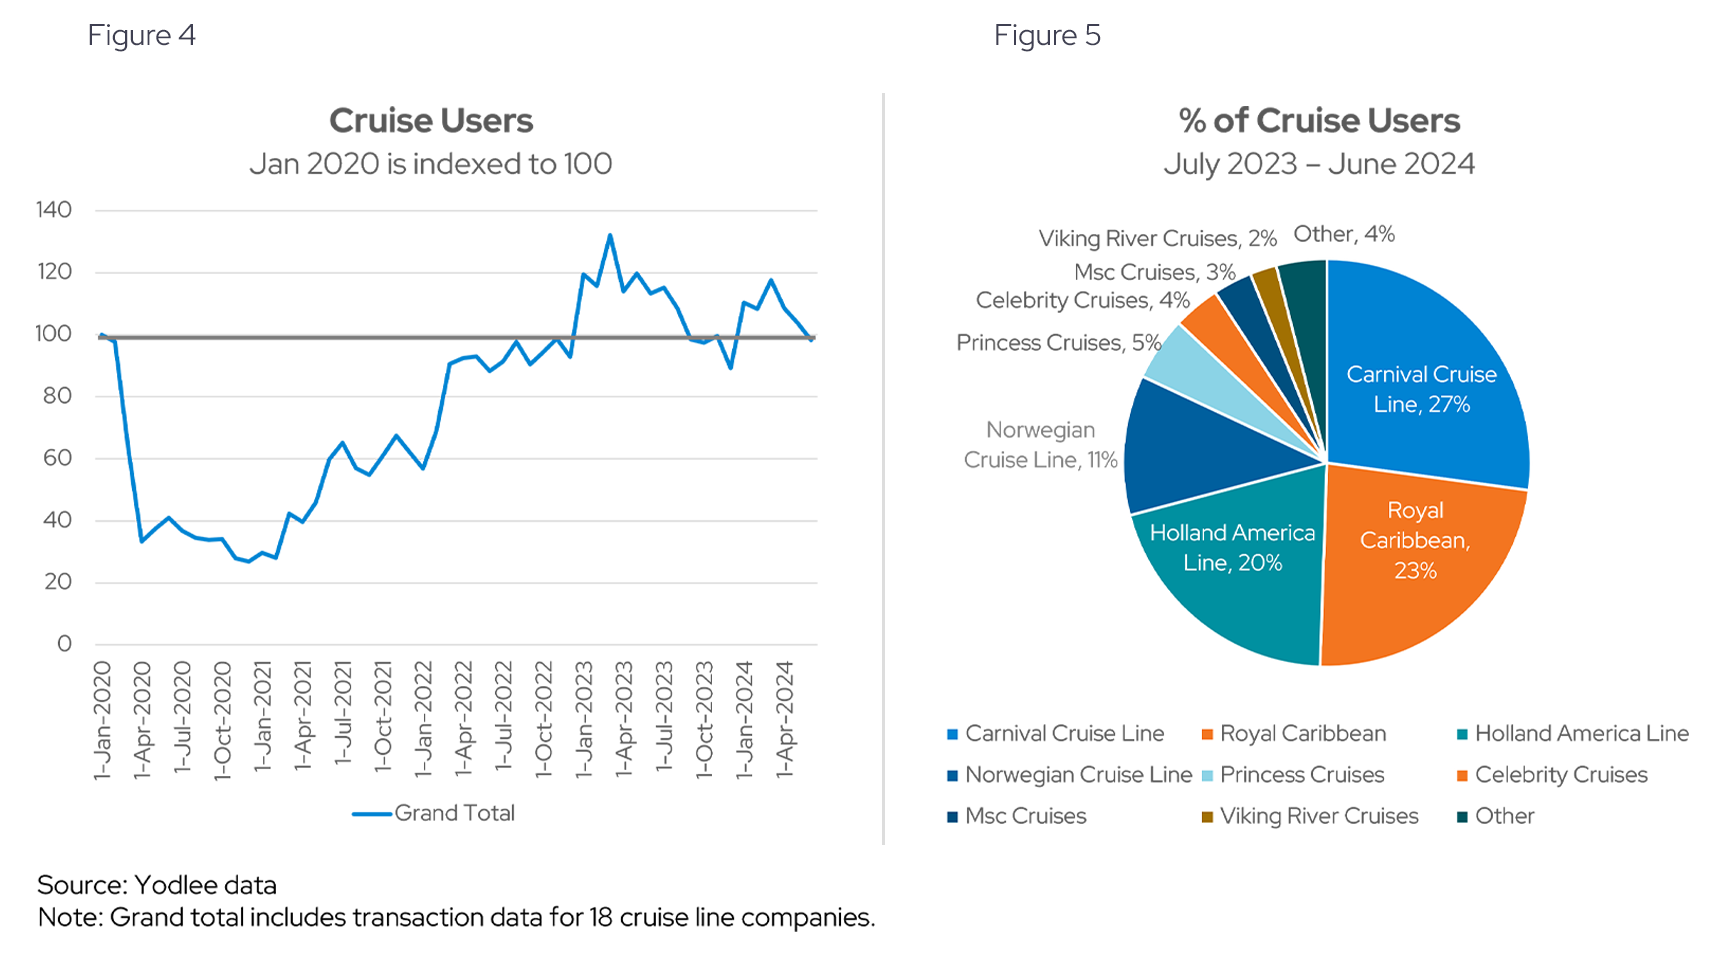
Yodlee data shows that the number of cruise users experienced a significant decline during the pandemic, with the lowest point occurring in April 2021 (see Figure 4). This downturn was expected given the global travel restrictions and health concerns at the time. However, as restrictions eased and consumer confidence returned, the number of cruise users began to steadily rise. By January 2023, user numbers surpassed pre-pandemic levels, signaling a robust recovery in the industry. The trend continued upward, reaching a peak in March 2023, reflecting renewed enthusiasm for cruise travel as more people sought sea-faring adventures.
Yodlee data reveals that Carnival Cruise leads the market with 27% of total cruise users, followed by Royal Caribbean at 23% and Holland America with 20% (see Figure 5). Despite Carnival Cruise’s dominance in user base, its share of total spending is lower, reflecting its more affordable pricing strategy that appeals to a broader audience. In contrast, Royal Caribbean, with slightly fewer users, captures a larger share of the total spending, indicating a more premium market position. Holland America, while holding 20% of users, also maintains a balanced share of spending, suggesting it appeals to travelers seeking a mid-range or premium experience. This comparison underscores the varying strategies of these top cruise lines, where Carnival drives volume with competitive pricing, while Royal Caribbean and Holland America focus more on capturing higher spending per user.
Higher income groups make up nearly half of cruise users
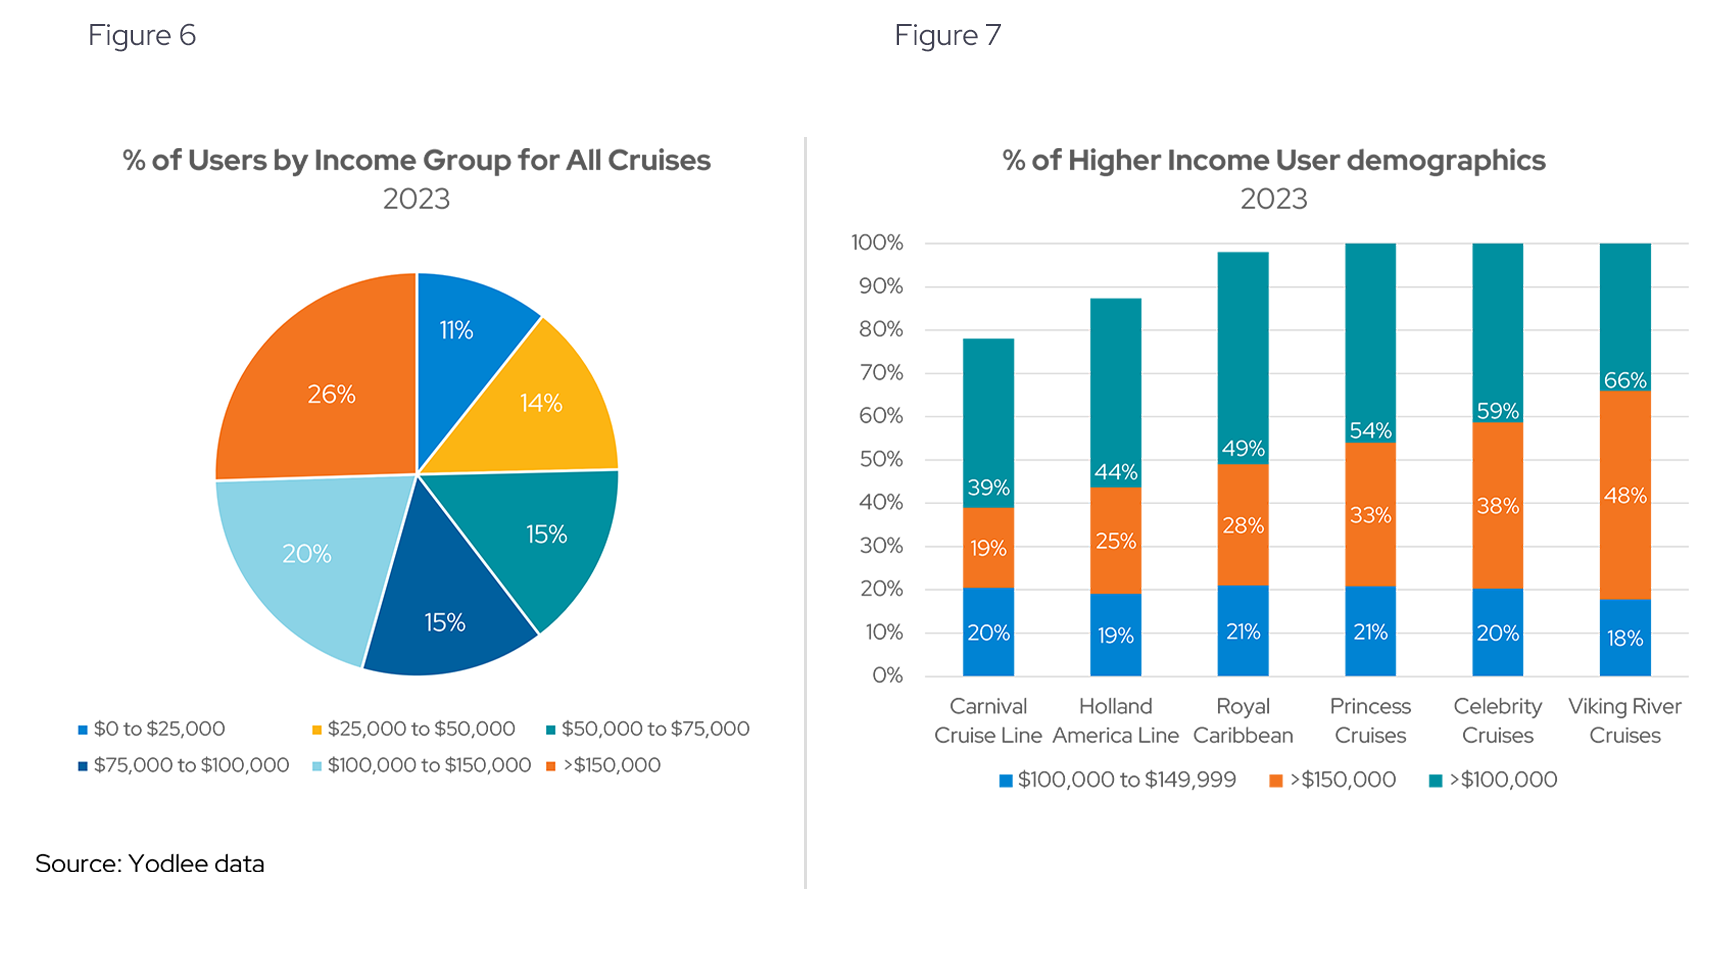
Yodlee data for 2023 indicates that cruise users tend to come from higher income brackets, with a significant 46% of all cruise users earning over $100,000 annually (see Figure 6). Specifically, 26% of users have incomes exceeding $150,000, while another 20% fall within the $100,000 to $150,000 range. This trend highlights the appeal of cruising to affluent consumers, who are more likely to spend on leisure travel.
Looking at users by brand, Yodlee data for 2023 suggests that Viking River Cruise predominantly attracts higher income users, with 66% of its customers appearing to earn over $100,000 annually (see Figure 7). This higher percentage aligns with Viking's position as a premium cruise line, offering luxurious and exclusive experiences and seems to resonate most strongly with affluent customers, setting it apart in the market. In contrast, Carnival Cruise and Holland America, with a lower proportion of high-income users, suggest a strategy that caters to a broader, more price-sensitive audience.
An evolving cruise industry
As the cruise industry charts a course through its post-pandemic recovery, the data reveals a sector that is evolving. Leading brands like Royal Caribbean, Carnival Cruise Line, and Norwegian Cruise Lines are capitalizing on renewed consumer interest, each with their distinct market strategies and demographic appeals. At the same time, luxury brands like Viking Cruises continue to carve out a niche among affluent travelers, underscoring the diverse landscape of cruising options available today.
The insights from Yodlee’s extensive transaction data highlight how the industry is navigating this period of resurgence, offering valuable perspectives for investors, market researchers, and industry stakeholders alike. As the cruise market continues to adapt and grow, these trends will undoubtedly shape the future of travel, setting the stage for new opportunities and challenges on the horizon.
Want to get ahead of consumer spending trends?
Subscribe to our research data blog for ongoing updates or reach out for a personalized, up-to-date view of Yodlee consumer spending data.
About Envestnet | Yodlee Merchant, Retail, Shopper, and Spend Insights
Envestnet | Yodlee Merchant, Retail, Shopper, and Spend Insights utilize de-identified transaction data from a diverse and dynamic set of data from millions of accounts to identify patterns and context to inform spending and income trends. The trends reflect analysis and insights from the Envestnet | Yodlee data analysis team. By combining data with intelligence – connecting vast amounts of actual de-identified shopping data with state-of-the-art analytics and machine learning – Envestnet | Yodlee provides visibility into a large set of shopping daily purchase behavior including, but not limited to, transactions, customer lifetime values, and merchant/retailer shares.
To learn more about Envestnet | Yodlee Merchant and Retail Insights and get a free demo, please contact an Envestnet | Yodlee sales representative.